Benefits of Gantt Charts in Project Management

Gantt Chart Interior Design Project

When we talk about Project Management the first thing that comes to our mind is the extensive work that needs to be done to initiate, plan and execute the plan to complete it within the requisite time. Small scale projects may not require as much effort to keep track of its progress, however a large scale project needs to be tracked and controlled with utmost accuracy to ensure its completion with total compliance with the client’s requisites.

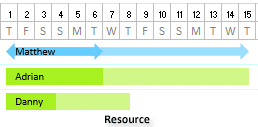
Gant charts are widely used in Project Management in Planning and tracking the various activities in a graphical representation. Named after Henry Gantt, an American Project manager, Gantt Charts are a great way of preparing a visual representation of Project schedules and track them as the project progresses. In this article, we will discuss some of the benefits of using Gantt charts in Project Management.

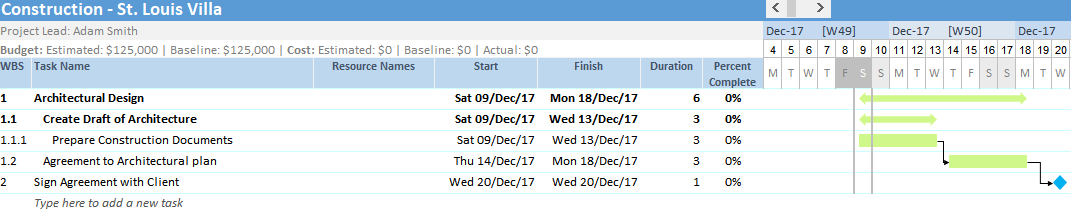
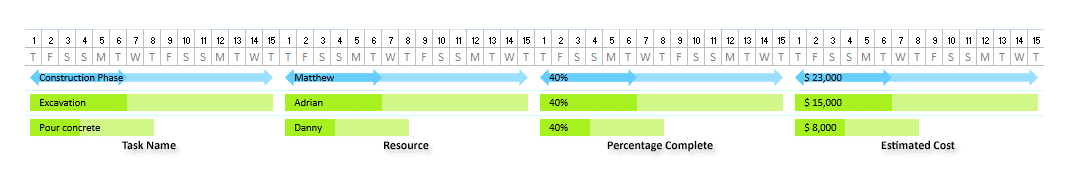
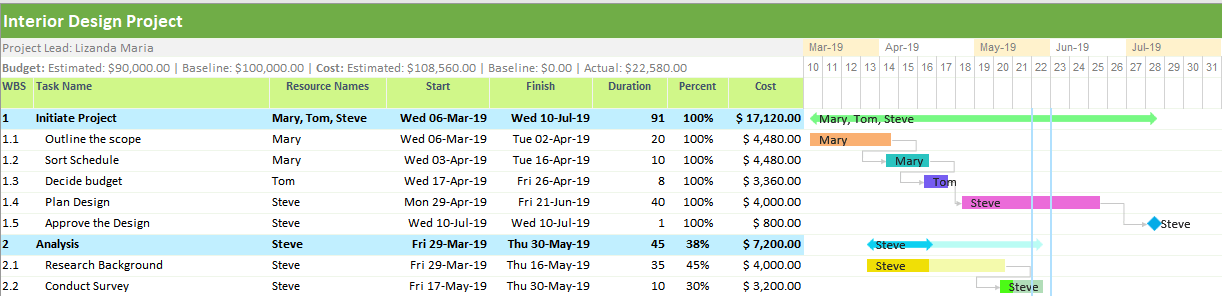
  1. Unified platform: Needless to say that in a Project there are multiple teams that work together on different aspects of the project. Keeping track of how the work is progressing with different teams may become difficult. This is where Gantt charts have the biggest advantage. Gantt Charts represent all the various aspects of the project on a single unified document like the progress, timelines, names of individuals, and others. This makes it extremely easy for the project owners or managers to keep abreast of all that is happening as work progresses.

  2. Time management: On time completion of a task is of utmost importance in the success of a Project. A delay in even a single task can withhold the timely completion of the Project resulting in financial and reputational risk. Gantt Chart’s feature of scheduling timelines and displaying the progress of the tasks help in a large way to understand the importance and the risks involved and avoid them with concerted efforts.

  3. Enhanced communication: Gantt Charts offers the feasibility of enhanced communications across departments pertaining to the updates on progress, issues and resolution of the same. Being a unified platform it becomes easy to communicate between teams through the Chart and in many ways can help to avoid physical meetings. This, of course, helps to keep a transparency across all the departments involved in the project.

  4. Resource management: A major reason why there could be a sudden drop in resource output is overburden. Gantt Charts helps Project managers to align resources and delegate tasks in a more effective manner. It gives a systematic picture of where the resources are being utilized associated with the corresponding timelines allowing completion of projects within the allotted budget and time.

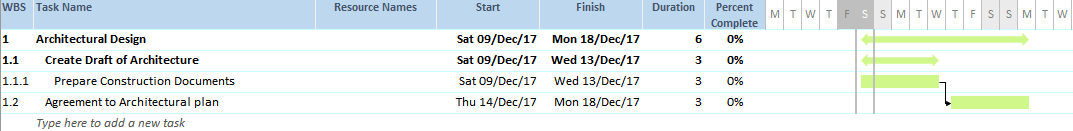
  5. Track progress of the project: Effective measurement of the progress of the Project is required not just for reporting to the Project owner and to the various teams involved but also to understand if the project is running on track and whether it will be completed on time. Progress Gantt Charts helps to understand to what degree the various tasks have been completed. It gives a visual representation of how the work has progressed and is very easy to interpret.

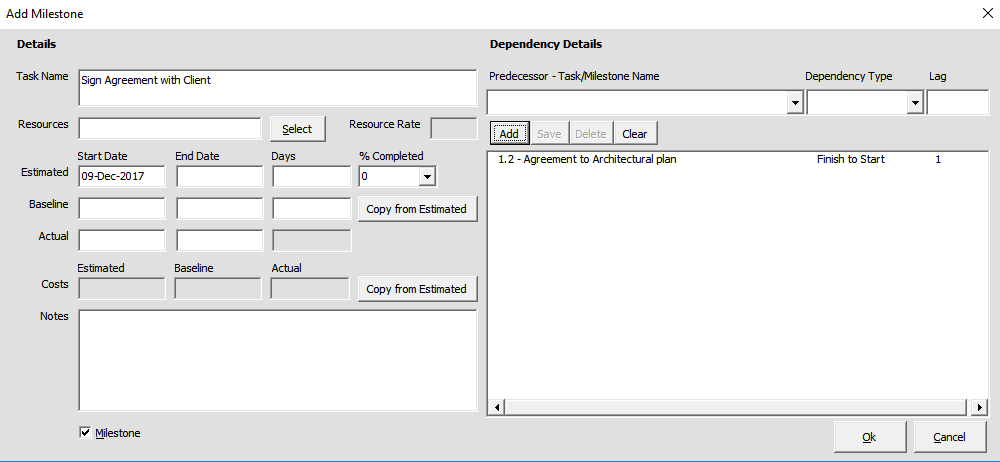
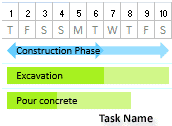
  6. Display milestones: Reaching milestones as a Project progresses can be very motivating for the entire team that is involved. Gantt charts help to display the milestones that have been reached which can really help to up the ante of the team members and enhance their focus to reach the target. Being a visual representation it is more effective and easily interpreted by all.

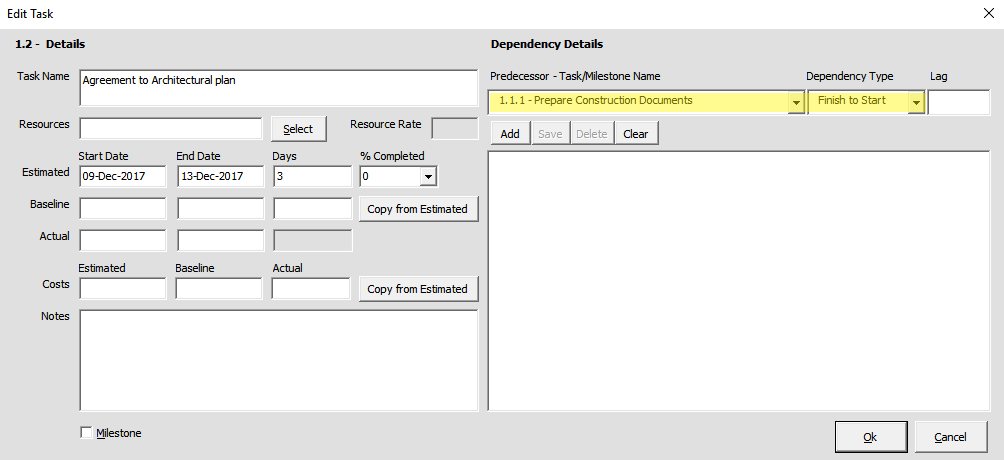
  7. Efficiency and interdependencies of tasks: Different teams work on different aspects of the project hence it is obvious that there will be interdependence in their tasks. Linked Gantt Charts indicates the dependencies between tasks with lines. Though it tends to become cluttered with lines for larger projects it is still preferred over other representation due to the ease of interpretation. Gantt chart software often comes with the feasibility to link task dependencies. This benefit of Gantt charts to trace the dependent activities and schedule them in such a way that they do not stall the progress of the Project in any way.

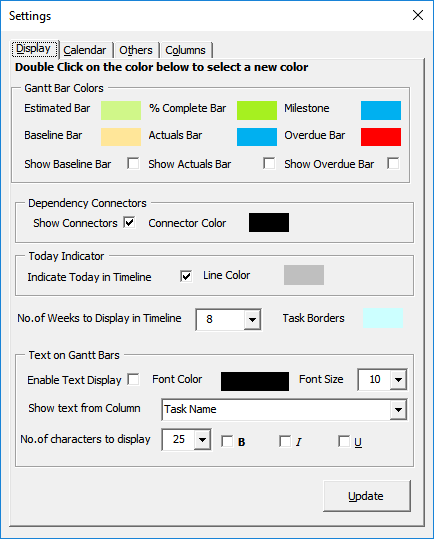
The benefits of using Gantt charts are manifold in Project management. The good news is that it is quite possible easily create Gantt Charts using an excel template like Gantt Chart Excel. The ease of updation and maintenance of Gantt Charts and the accessibility to all the relevant information makes it one of the most favoured project management tools.

How to Create a Gantt Chart in Excel

Gantt Chart Excel – How to Create a Gantt Chart in Excel

Step-by-Step Tutorial for Making a Gantt Chart in Excel

We all love Microsoft Excel and we use it almost every day for everything – from a simple calculator to tracking massive projects. There’s just one thing that Excel is not good at and that is creating Gantt charts. For this reason, we created Gantt Excel, an automated excel template that allows you to create professional-looking Gantt Chart in Excel.
Microsoft Excel is instantly familiar and widely used, so everyone on your team “gets it” and hits the ground running.

Before we begin, what is a Gantt Chart?

Gantt chart is a type of bar chart, adapted by Karol Adamiecki in 1896 and independently by Henry Gantt in the 1910s, that illustrates a project schedule. It is a graphical illustration of the duration of tasks against the progression of time. Gantt charts are useful tools for planning and scheduling projects.

Gantt Chart Example

Gantt Chart Excel Example

Here are the steps to create Gantt Charts in Excel

  1. Download our Free Gantt Chart Template

    Gantt Chart Excel
    Save
    the excel template to your Desktop or your My Documents folder. Note, our template works in Excel 2007, Excel 2010, Excel 2013 and Excel 2106 on Windows and Excel 2016 on the Mac.

  2. Open the Gantt Chart Template

    Click on the Enable Macros & Enable Editing button. Note that there is no installation. It’s just a simple excel template and it opens just like any other excel file.

    The Gantt tab in the excel ribbon will instantly load.Gantt Excel Ribbon

  3. Create a New Gantt Chart

    Click on the Add New Gantt Chart button to bring up the Project Details window.

    Enter the Project Name, Worksheet Name, Project Lead and the Estimated/ Baseline Budget for the Project.
    Add New Gantt Chart

    Click the Ok button when done. A new Gantt Chart is automatically created for you. You don’t have to bother about setting up complicated conditional formatting or creating any graphs.
    Everything is automated and that’s the best part.Default Timeline

  4. Add Tasks

    Gantt charts don’t give useful information unless they include all of the tasks/ milestones needed for a project to be completed.
    So, to start, list all of the activities as tasks. There are three ways to add tasks in Gantt Excel

    Method 1: Type directly into the excel grid. If you type a task where it says “Type here to add a new task“, it will automatically create a new task with default start and end dates and the timeline will instantly update.

    Method 2: Click the Add Task button on the Gantt tab

    The task details form will open up where you can enter all the task details including task resource, estimated, baseline, actual – start and end dates. You can also keep track of costs including estimated, baseline and actual costs, therefore making it an excellent budget and costs planner.
    Task notes can also be captured to include a short description of your task to clarify its purpose or scope and to provide additional info to everyone involved.Gantt Chart Task Form
    Click the Ok button when you are done. The newly added task will show up in the excel grid with all the details.

    Go ahead and add a few tasks like in the example below and set the start and finish dates.
    tasks in gantt chart excel

    Importantly, note that the Work Break Structure (WBS) is automatically calculated and set for you.

  5. Set Parent and Child Tasks

    If a task is relatively large and requires several users with different skills to manage, break the task into subtasks and create parent-child relationships.

    To set parent-child relationships, select a task that you want to convert to a child task and click on the Make Child button.
    make-child-task
    Shortcut – Alt Right arrow key

    To create a parent task from a child task click on the Make Parent button.
    make-parent-task
    Shortcut – Alt Left arrow key

    As a result, when you group child tasks together under a parent, values such as dates, costs etc. aggregate and roll up to the parent task.

    This is how the tasks look when I set a few tasks as child tasks.

  6. Set Task Dependencies

    Setting dependencies between tasks is the most powerful feature of Gantt Excel. The in-built auto-scheduling automation of the template is able to update the dates based on changes made to its dependent tasks.
    To Add task dependencies doubleclick task 1.2. This will open up the Edit Task Details window.
    Adding Task Dependencies

    In this example, we are setting 1.1.1 as the predecessor task with a Finish to Start dependency. Click Add and then Ok to confirm.
    This basically means that this task can start only when task 1.1.1 finishes. Also, notice how the taskbar in the timeline moves automatically after the end date of the predecessor task.

    Click here to read more about task and milestone dependencies.

  7. Add Milestones

    Milestones help your team stay on track and to more accurately determine whether or not your project is on schedule.
    Use a key deadline as a milestone to reflect when a section of tasks or key task is completed.

    To Add a Milestone click on the Add Milestone button in the Gantt tab.
    Add Milestone

    This will bring up the Add Milestone details window. In this case, I’m setting this milestone to be dependent on task 1.2 with a Finish to Start dependency with a lag of 1 day. Click Ok when done.
    Milestone Details

    To illustrate, see the example below. The milestone and a diamond-shaped symbol appear in the timeline.

Gantt Excel Settings

Equally important, is to set up the Gantt chart correctly. Let’s look at all the settings screens and go through them one by one.
Click on the Settings icon in Gantt tab.

Display Settings
By default, the Display tab opens up first. Here you can set all the different timeline bar and milestone colors.
You can also choose to show additional timeline bars for baseline, actual dates and the overdue bar for all overdue tasks.

If you want to see more of the timeline then you can increase the “No of weeks to display in timeline” setting.

Lastly, one of the most sought out features is to show Text within the Gantt Bars. You can check the Enable Text display option and select any text from any column to show within the Gantt bars.

This is how it looks when the Show Text in Gantt Bars is enabled. We think it is one of the finest features of Gantt Excel.
Show Text in Gantt bars
Calendar Settings
The calendar tab is where you can select Workdays. You can also select the way the week numbers are calculated by either using Excel’s week calculation or use the ISO week calculation.

Other Settings
Switch over to the Others tab to set Currency symbol and Date format.
Additionally, you can define how Percentage complete is calculated for the tasks. You can use the Manual or Automatic mode for entry and use simple or weighted calculation for the Parent task roll-up calculation.

Columns Settings
Finally, we have the columns tab where you can hide or unhide existing columns. In like manner, you can also insert your own custom columns or delete them if required.

Columns Settings

Gantt Excel – The Smart Way to Plan

In Conclusion, the beauty of Gantt Excel is we have six calendar views to choose from namely Daily, Weekly, Monthly, Quarterly, Half-Yearly and Yearly View.

From here you can easily customize the Gantt chart by changing timeline colors, and adding various details like percent complete, costs etc…  As shown below, with some tweaks you can create a timeline that’s sure to impress.

Gantt Chart Excel Template – Download Now

It is the best free Gantt chart software out there.

Top 5 Effective Ways to Manage Projects Successfully

As Project Managers we often find ourselves juggling with project deadlines, accommodating unexpected events, exceeding allocated budget and resources etc. Events like these are frustrating and can leave project managers and the team stressed and unmotivated. Here are top 5 effective ways to manage projects successfully.

Project Management Team

Here are 5 effective ways that can help you stay ahead of the game and manage projects successfully.

1. Brainstorm with the team:

During the conception and planning phase of the project, involve people that are going to be part of the project for brainstorming sessions.  It will give them an overall understanding of the project and how their roles add up to the project and what is expected of them becomes transparent. This also helps managers and the team measure how much effort is required from each individual or department. In turn, it allows the project managers to more accurately determine the project’s scope, budget and timeline.

2. Plan the project’s scope, timing and resources in detail:

Project planning phase lays the blueprint on how the project implementation will take place. As the saying goes, “failing to plan is planning to fail”, it is important to ensure that all major aspects of the project like project scope, the timeline for the project, deliverables, allocated tasks, resources required should be carefully crafted. The team should also consider assumptions and risks and build them into the project plan. Once, this step is done, create a detailed work plan and communicate this with the team. Ensure that any high-level activities that were initially vague are defined more in detail as their time-frame gets closer.
The best tool to plan your projects is to use our simple yet effective Gantt Chart Excel Template. Our Gantt Excel tool allows you to create project timelines, allocate tasks and resources, create milestones, define dependencies, even break down the project into smaller tasks and can be easily updated and communicated as the project progresses. You can download Gantt Chart Excel here.

Gantt Chart Excel Example

3. Track your project’s progress:

This is the ‘holy grail’ of project management. Using Gantt Chart Excel you can monitor the project budget and timelines which allows you to proactively optimize your resources and budget to meet the project timelines.

Remember, “What gets measured, gets managed”, Peter Drucker.

4. Take steps to mitigate risks: 

 As project managers, we are all aware how big a part risks play in project success. Risks of unforeseen circumstances in the future, the risk of exceeding budget, risks of project delays, risk of low team morale and so on. Acknowledging that these risks can creep up anytime prepares the managers to be vigilant for warning signs of risks and also prepare for mitigating risks. Gantt chart again is an effective tool that can flag you in advance about the abnormalities in the project’s progress. For instance, if a deadline has been missed, project managers can get to the root of what caused the delay and fix it or if some unavoidable events are probable in the near future which wasn’t evident during the planning phase, the Gantt chart can be updated to reflect this and activities planned accordingly. ‘Scope creep’ is another risk that can sabotage the project success. These mini changes can actually add up to changing the whole scope of the project making the initial budget, resources and timelines irrelevant. Therefore as project managers, we need continue to assess potential risks throughout the project.

5. Celebrate milestones:

Take steps to ensure that team’s morale is high throughout the project.  It can be quiet stressful to balance the execution in the midst of some unavoidable circumstances that delay the project. Therefore creating milestones (mini goals) and celebrating these milestones can motivate the team to stay on track and to work towards accomplishing the project as Harvard Professors T Amabile and S J Kramer describe in their research titled ‘ The Power of Small Wins’ that “even small wins can boost inner work life of the team tremendously”.

These five ways will help you effectively manage your project. I will leave you with a quote by Scott Berkun, author of, ‘Making Things happen- Mastering Project Management’ that “The challenge of managing projects isn’t sailing in calm, open waters with clear skies. Instead, the challenge is in knowing how to juggle, prioritize and respond to all the unexpected and difficult things that you’re confronted with”.

Good Luck with your project.

New to Project Management?

New to Project Management? If you’re just getting started as a project management professional, then hat’s off to you! To pave your way to a brilliant career, here are some insights for new project managers.

Definition:

Project Management as defined by the Project Management Institute “is a temporary endeavor undertaken to create a unique product, service or result with a defined beginning and end in time, defined scope and define resources”.

Mind Map representation of Project Management Knowledge Areas

Project Management Mind Map

Project on the other hand differs from process which happens continually and has low risk while project unique to each goal has a relative high level of risks. Therefore risk minimization is one of the important factors to consider during project management, especially as we are constrained by time, budget and resources. By carefully planning and managing the project’s life cycle, we can mitigate most of the project risks.

Project Management Life Cycle

PMI’s A Guide to the Project Management Body of Knowledge (PMBOK Guide) identifies project life cycle as:

Project Management Life Cycle

Initiating Phase:

Also known as ‘conception’ phase, here the team identifies the goal to be achieved and gathers the resources required to get started.

Planning Phase:

Here the team meticulously devises schedule of tasks, allocates tasks and resources required to accomplish the project goals. Project timeline is created with milestones set so that the project’s progress can be monitored. It is during this phase and here after that it is most essential to use a Gantt Chart.

Gantt Chart Excel Example

Gantt Excel allows you to visually represent the progress of your project by providing a comprehensible snapshot of your project’s status.

In the Gantt chart, you begin by creating a timeline for the project, setting milestones (smaller achievements leading to achieving the bigger goal), you define dependencies if any (activities that need to be undertaken before or after a certain task), thus giving you and your team the minimum total time required to complete the project (also called Critical Path Model).

Gantt chart also allows you to allocate tasks and resources, delegate tasks and allows you to share responsibilities.

You can easily build your own Gantt chart by using Gantt Excel. Gantt Excel is an automated excel template and it is super easy to use. It takes a minute to download you have can have a pretty cool looking Gantt chart in a few minutes.

Risks associated with storing your project data on the cloud
Unlike other online Gantt charts and softwares out in the market, your project date is safe in your computer when you use Gantt Chart Excel and not in a random cloud server where there are significant risks associated with storing data. Since Gantt Chart Excel is an advanced excel template the data is stored on your personal computer just like you would store any other excel file.
However, you can share your project plan with your colleagues and clients and they will be able to view and actively update the Gantt chart as required. Also, our Gantt Excel template requires no learning curve as most of your team members are used to using Excel either in Windows or macOS.

Executing Phase:

This phase is where all the actions happen. The team members co-ordinate and execute their tasks. Generally, a project manager oversees the whole project, communicating with the team about the progress, adding resources if needed and basically ensuring that execution phase complies with the planning phase. Ideally planning phase is the blueprint for the execution phase; however in real world, due to un-anticipated events and external forces, it is reasonable that execution phase might go tangent from planning phase. Therefore, it is important to ensure that some buffer time for these events is considered during the initiation and planning phase of the project. This is also why you should actively update your Project Gantt chart to keep your progress on track and accurately record the accomplishment of the tasks, sticking with the timeline.

Controlling Phase:

This phase occurs simultaneously with the executing phase as execution and controlling/ managing projects go hand in hand. Handling unexpected hurdles and also keeping the track of the project according to the planning are involved in ensuring the project is a success. It can get frustrating to balance both during this phase especially as we are time, budget and resource constrained. It is important to keep the team’s morale high during this phase. This is why celebrating ‘milestones’ is good to lift up team spirit. Gantt Chart Excel allows you to create milestones and even break the primary tasks into child tasks so that responsibilities can be further shared and delegated thus reducing the burnout that team might experience during this balancing phase of execution and control.

Closing Phase:

As we come close to the end of the project, it is said that the momentum is often lost during the last 10% of the project. The team feels like everything is finished and they forget to find details that take a lot of time. This is where a Gantt chart can actually help the team to track every details of the project and also keep the motivation high so that you don’t miss out on details as they say, ‘the devil is in the details’.

“Voila! Our project is now complete.” It is also recommended that you revisit your project details from conception to the closing phase to see what worked and what didn’t and what can be learnt. This is the time to review the Gantt chart to go back and revisit the project details with every detail recoded precisely and accurately.

With this, Gantt Excel team wishes you All the best for your new project.

Show Text in Gantt Bars – Create Elegant Project Timelines

Everyone loves our latest new feature “Show Text in Gantt Bars“. This takes the design of the Gantt chart to a whole new level.
You can now display any text within the Gantt bars in Gantt Chart Excel. This allows you to show the right amount of detail to understand the project plan instantly.

First of all, there are very few Gantt chart programs that can do this and none of them allow you to customize the timelines to such an extent.

Show Text in Gantt Bars

Here is another screenshot of a few examples of text within the timeline bars. You can show the task name, resources, percentage complete, costs and literally anything you can think of.
As a result, this makes your Gantt chart fancy and yet easy to read.

Show Text in Gantt Bars - Examples

How to Show Text within Gantt Bars

Click on the Settings icon in the Gantt tab and enable Text Display

Furthermore, you can also customize by changing the font color, size and the number of characters you would like to display in the timeline bars.

Show Text in Gantt Bars - Settings