Customizing the Gantt Chart Timeline Colors
You can easily customize the Gantt Chart with a few clicks of the mouse. We have six themes in the Display tab that you can choose from…
- Blue
- Classic
- Excel
- Dark
- Custom
If you’d like to create your own theme with your custom colors then select the Custom theme. You will then be able to select each color to change it to the one you want.
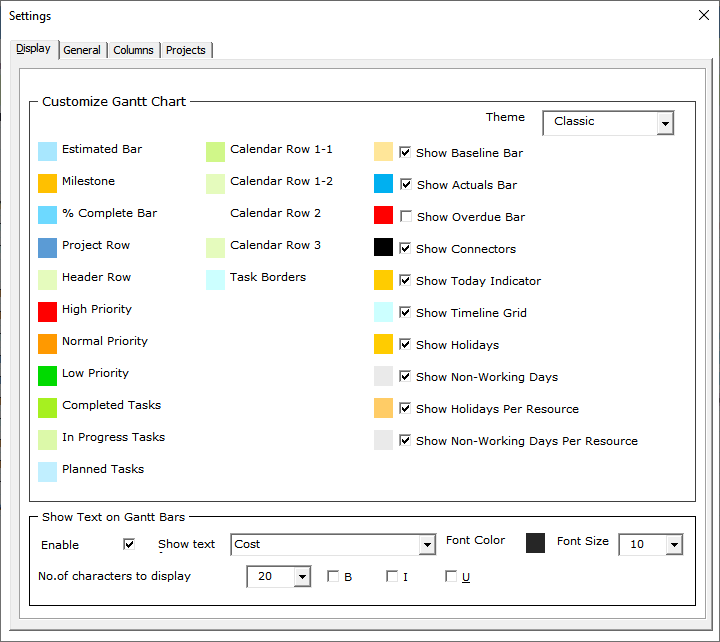
The Gantt Excel timeline colors include Gantt bars and other colored shapes representing…
- Estimated Bar – Estimated bar drawn between the Start and Finish Dates
- Milestone – Milestone Icon
- % Complete Bar – Task Percentage overlay bar
- Project Row – Project Row background-color
- Header Row – Header Row background-color
- High Priority – Task Priority color for High Priority
- Normal Priority – Task Priority color for Normal Priority
- Low Priority – Task Priority color for Low Priority
- Completed Tasks – Task Status color highlighted in the first column
- In Progress Tasks – Task Status color highlighted in the first column
- Planned Tasks – Task Status color highlighted in the first column
- Calendar Row 1-1 – Background-color for 1st Calendar Row
- Calendar Row 1-2 – Alternate Background-color for 1st Calendar Row
- Calendar Row 2 – Background color for 2nd Calendar Row
- Calendar Row 3 – Background color for 3rd Calendar Row
- Task Borders – Task Border color
- Show Baseline Bar – Baseline bar drawn between Baseline Dates
- Show Actual Bar – Actual bar drawn between Actual Dates
- Show Overdue Bar – Overdue bar for tasks ending before Today and % complete < 100%
- Show Connectors – Dependency arrows
- Show Today Indicator – The Today Line indicating Today’s date
- Show Timeline Grid – Vertical gridlines in the Timeline
- Show Holidays – Holiday indicators in the Calendar Headers
- Show Non-Working Days – Non-working day indicators in the Calendar Headers
- Show Holidays Per Resource – Holiday indicators for the task row if a resource is assigned
- Show Non-working Days Per Resource – Non-working day indicators for the task row if a resource is assigned
- Show Text on Gantt Bars – Show text from any column in the Gantt Chart
Note: Drawing Text on Gantt Bars is a resource-intensive job when you have hundreds of tasks. We recommend that you turn it off when working on the Gantt Chart and turning it back on when presenting the Gantt Chart
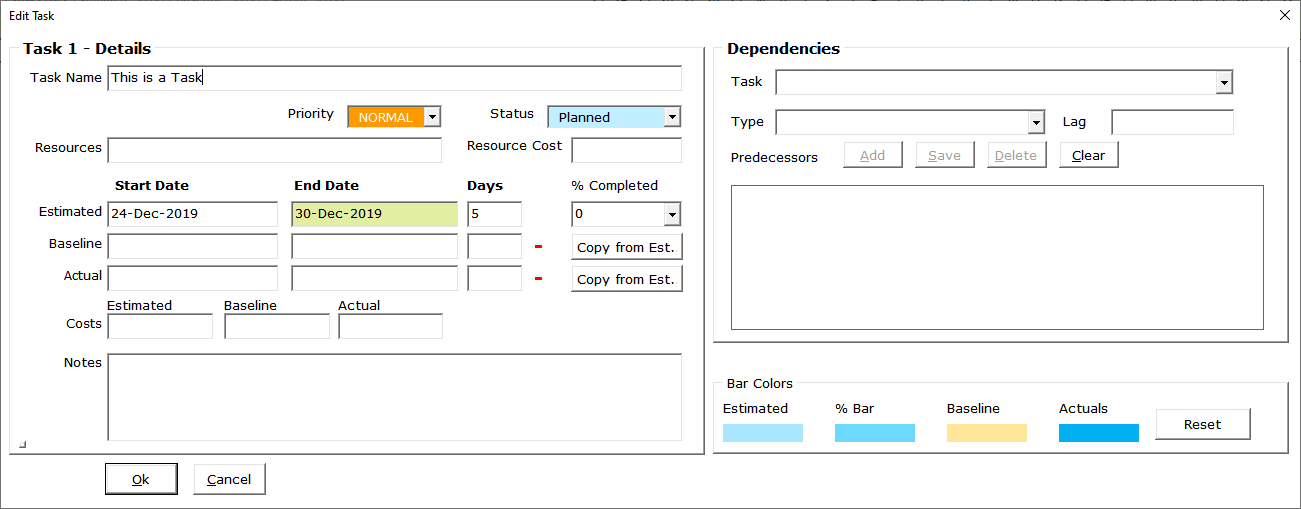
Changing Colors of Individual Bars and Milestones
You can also change the color of each individual bar or milestone marker
- To do this, just double-click the task or milestone. Change the colors under the Bar Colors section and then hit the Ok button.