
A milestone chart is a simple way to schedule and illustrate milestones in your project. Milestones are usually represented as a part of Gantt Charts but for a high-level overview, a milestone chart is necessary. Milestone charts provide a snapshot of your project for important presentations and communications with senior management and clients.
Example of a Milestone Chart created in Gantt Excel
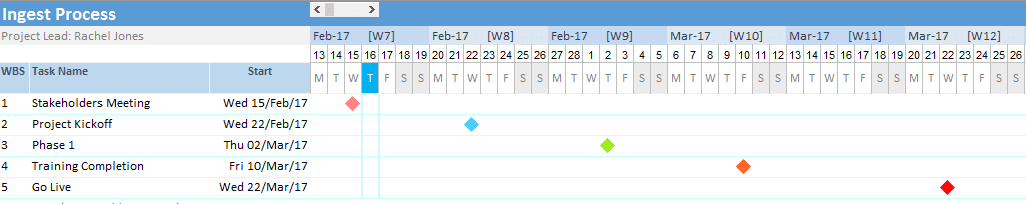
Milestone charts are created to present to high-level management and clients to illustrate the important events, goals and targets of a project. Milestones could be the initiation or completion of a particularly important or critical activity, key deliveries, reviews, or approval dates. This makes the milestone chart an excellent tool for planning projects or managing programs where visualizing the key components need to be displayed in chronological order on a time schedule. Milestones on a milestone chart can also be shown in various colors to indicate status.
Since milestone charts provide a summary view of a project they are easier to communicate than a full-fledged Gantt Chart with tasks. Milestone charts are excellent planning tools as they show key events on a timescale culminating in the completion of a project.
The milestone chart as seen in the above screenshot was created with our free Gantt Chart Excel template. Click on the button below to download Gantt Excel.