
New to Project Management? If you’re just getting started as a project management professional, then hat’s off to you! To pave your way to a brilliant career, here are some insights for new project managers.
Definition:
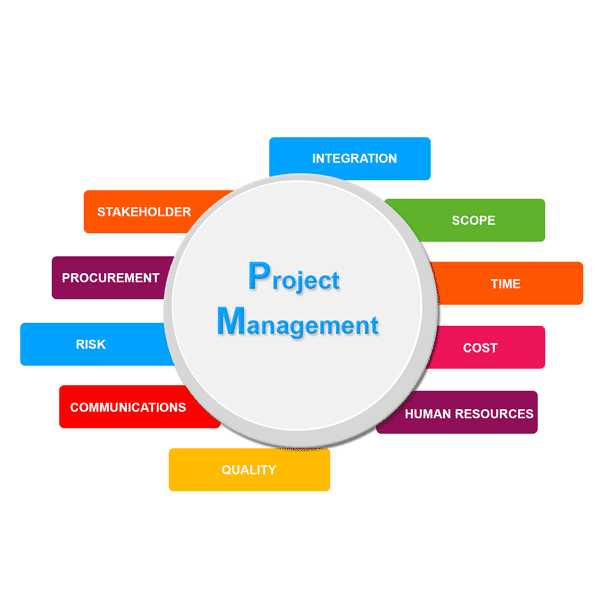
Project Management as defined by the Project Management Institute “is a temporary endeavor undertaken to create a unique product, service or result with a defined beginning and end in time, defined scope and define resources”.
Mind Map representation of Project Management Knowledge Areas
Project on the other hand differs from process which happens continually and has low risk while project unique to each goal has a relative high level of risks. Therefore risk minimization is one of the important factors to consider during project management, especially as we are constrained by time, budget and resources. By carefully planning and managing the project’s life cycle, we can mitigate most of the project risks.
Project Management Life Cycle
PMI’s A Guide to the Project Management Body of Knowledge (PMBOK Guide) identifies project life cycle as:
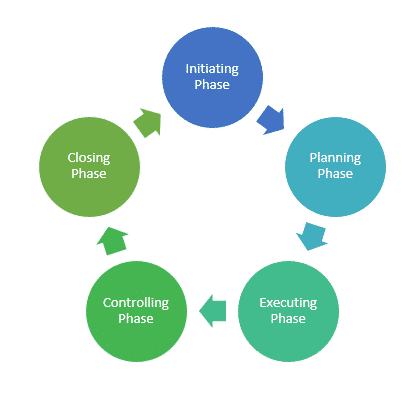
Initiating Phase:
Also known as ‘conception’ phase, here the team identifies the goal to be achieved and gathers the resources required to get started.
Planning Phase:
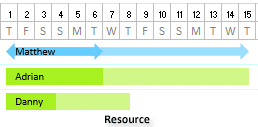
Here the team meticulously devises schedule of tasks, allocates tasks and resources required to accomplish the project goals. Project timeline is created with milestones set so that the project’s progress can be monitored. It is during this phase and here after that it is most essential to use a Gantt Chart.

Gantt Excel allows you to visually represent the progress of your project by providing a comprehensible snapshot of your project’s status.
In the Gantt chart, you begin by creating a timeline for the project, setting milestones (smaller achievements leading to achieving the bigger goal), you define dependencies if any (activities that need to be undertaken before or after a certain task), thus giving you and your team the minimum total time required to complete the project (also called Critical Path Model).
Gantt chart also allows you to allocate tasks and resources, delegate tasks and allows you to share responsibilities.
You can easily build your own Gantt chart by using Gantt Excel. Gantt Excel is an automated excel template and it is super easy to use. It takes a minute to download you have can have a pretty cool looking Gantt chart in a few minutes.
Risks associated with storing your project data on the cloud
Unlike other online Gantt charts and softwares out in the market, your project date is safe in your computer when you use Gantt Chart Excel and not in a random cloud server where there are significant risks associated with storing data. Since Gantt Chart Excel is an advanced excel template the data is stored on your personal computer just like you would store any other excel file.
However, you can share your project plan with your colleagues and clients and they will be able to view and actively update the Gantt chart as required. Also, our Gantt Excel template requires no learning curve as most of your team members are used to using Excel either in Windows or macOS.
Executing Phase:
This phase is where all the actions happen. The team members co-ordinate and execute their tasks. Generally, a project manager oversees the whole project, communicating with the team about the progress, adding resources if needed and basically ensuring that execution phase complies with the planning phase. Ideally planning phase is the blueprint for the execution phase; however in real world, due to un-anticipated events and external forces, it is reasonable that execution phase might go tangent from planning phase. Therefore, it is important to ensure that some buffer time for these events is considered during the initiation and planning phase of the project. This is also why you should actively update your Project Gantt chart to keep your progress on track and accurately record the accomplishment of the tasks, sticking with the timeline.
Controlling Phase:
This phase occurs simultaneously with the executing phase as execution and controlling/ managing projects go hand in hand. Handling unexpected hurdles and also keeping the track of the project according to the planning are involved in ensuring the project is a success. It can get frustrating to balance both during this phase especially as we are time, budget and resource constrained. It is important to keep the team’s morale high during this phase. This is why celebrating ‘milestones’ is good to lift up team spirit. Gantt Chart Excel allows you to create milestones and even break the primary tasks into child tasks so that responsibilities can be further shared and delegated thus reducing the burnout that team might experience during this balancing phase of execution and control.
Closing Phase:
As we come close to the end of the project, it is said that the momentum is often lost during the last 10% of the project. The team feels like everything is finished and they forget to find details that take a lot of time. This is where a Gantt chart can actually help the team to track every details of the project and also keep the motivation high so that you don’t miss out on details as they say, ‘the devil is in the details’.
“Voila! Our project is now complete.” It is also recommended that you revisit your project details from conception to the closing phase to see what worked and what didn’t and what can be learnt. This is the time to review the Gantt chart to go back and revisit the project details with every detail recoded precisely and accurately.
With this, Gantt Excel team wishes you All the best for your new project.