Monthly Gantt Chart

Create a Monthly Gantt Chart in Minutes

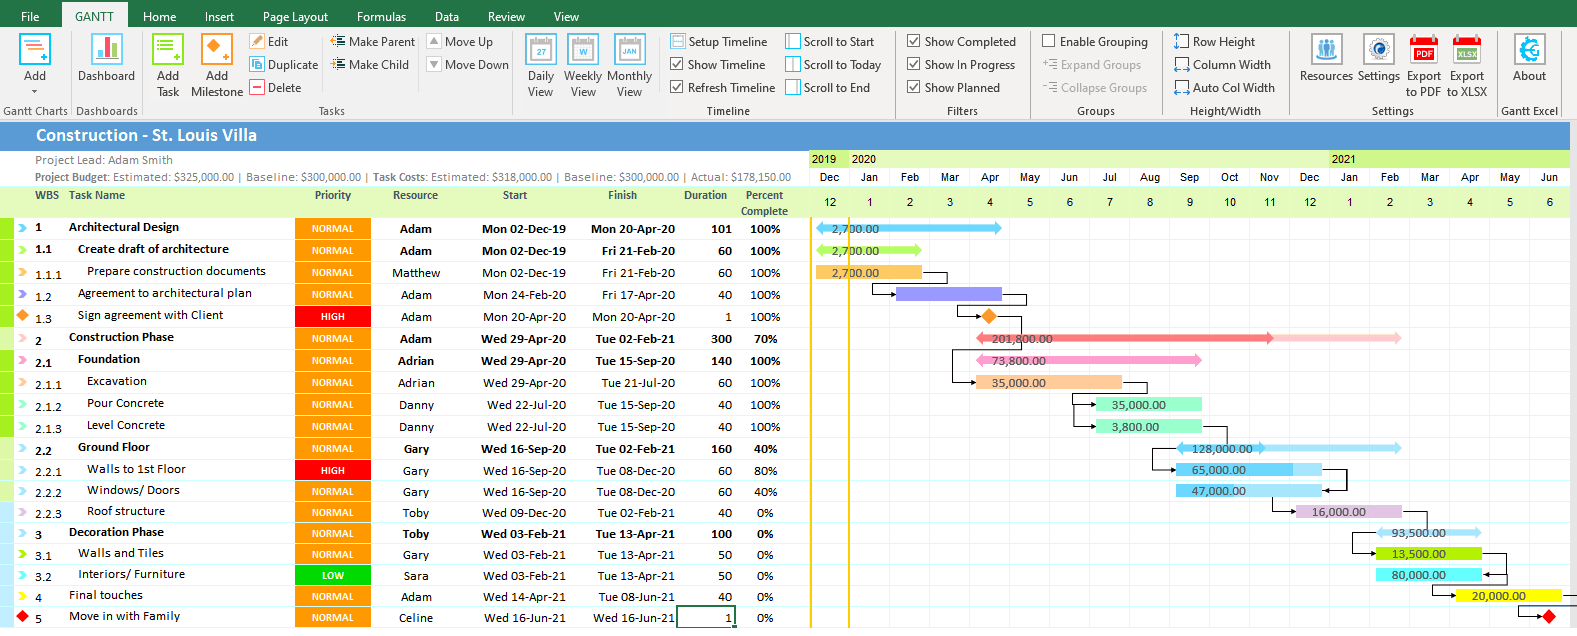
You can create a Monthly Gantt Chart in Gantt Excel in minutes. All you have to do is create a Gantt Chart in Gantt Excel and click on the Monthly View button in the Gantt Menu. The monthly view will render instantly with the calendar timeline displaying all the months of the year.

Monthly View Button

The Monthly view is particularly helpful for projects that run for a couple of months or to a few years.

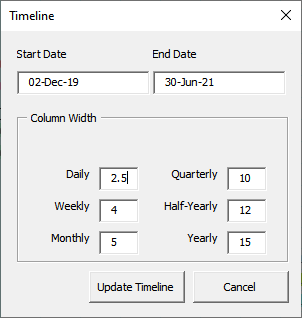
Click on the Setup Timeline button in the Gantt menu to select the start date and end date for the timeline. Based on the selection, Gantt Excel will automatically display the months between the two dates.

Gantt Timeline Range

The Gantt bars will automatically display based on the tasks and milestone dates.

Gantt Excel also supports a three-month Gantt chart project timeline as a quarterly view, a six-month Gantt Chart as a half-yearly view and a 12 month timeline as well.


Make a Monthly Timeline Gantt chart with Tasks & Milestones

Gantt Excel Monthly View
Monthly Gantt Chart

Here is an example of a Monthly Gantt Chart created in Gantt Excel

Gantt Excel gives you the ability to see every step of your project from the first Month to the last Month.

4.9 out of 5 rating for Gantt Excel based on Real User Reviews

Create Gantt Charts in Microsoft Excel 2007, 2010, 2013, 2016 & 2019 on Windows and Excel 2016 & 2019 on macOS.
Also works on all versions supported by Office365/ Microsoft 365.

1,730,000+

Amazing People Use Gantt Excel

Make Better Decisions Faster with Monthly Gantt Charts in Gantt Excel

From simple task management and project planning to complex resource management, Gantt Excel helps you improve collaboration and increase work velocity — empowering you to get more done. 

You can download the monthly gantt chart by clicking the orange download button.