Weekly Gantt Chart

Create a Weekly Gantt Chart in Minutes

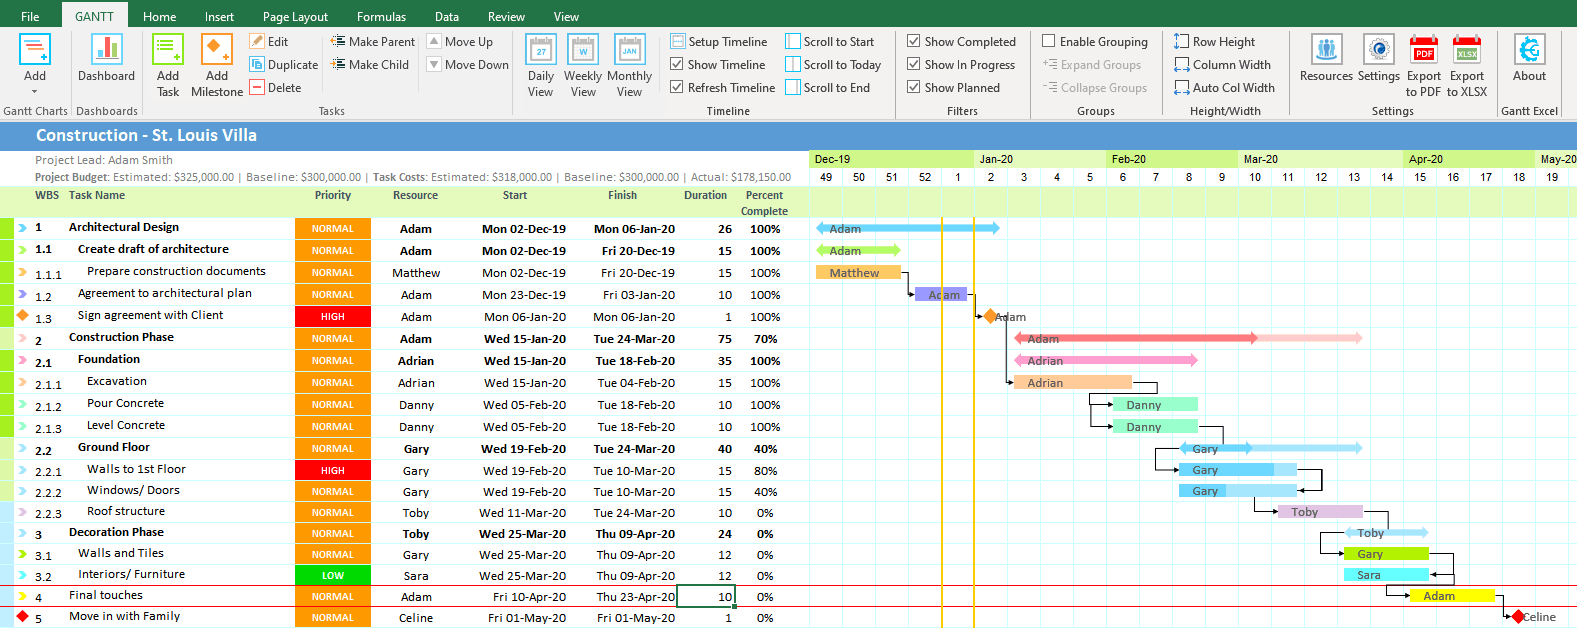
You can create a Weekly Gantt Chart in Gantt Excel in minutes. All you have to do is  create a Gantt Chart in Gantt Excel and click on the Weekly View button in the Gantt Menu. The weekly view will render instantly with the calendar displaying all the weeks of the year. We use ISO weeks for the week number calculation and views.

Weekly View Button

The weekly view is particularly helpful for projects that run for a couple of weeks or to a few months.

Gantt Excel Weekly View

Here is an example of a Weekly Gantt Chart created in Gantt Excel

Gantt Excel gives you the ability to see every step of your project from the first Month to the last Month.

This simple Weekly Gantt Chart template makes it easier to plan, schedule and finish projects.  The weekly timeline helps you visualize the important task and phases in your planning process.

You also have the ability to select the week work-days and weekends to define a custom work week.

4.9 out of 5 rating for Gantt Excel based on Real User Reviews

Create Gantt Charts in Microsoft Excel 2007, 2010, 2013, 2016 & 2019 on Windows and Excel 2016 & 2019 on macOS.
Also works on all versions supported by Office365/ Microsoft 365.

1,730,000+

Amazing People Use Gantt Excel

How to make Gantt charts by weeks in Excel

Download Gantt Excel and build a Gantt chart in minutes, collaborate with others, and make edits in real time.

The Gantt chart will show the key activities that make up the overall plan, including the features that will be delivered. You can track the priority,  status of each task by changing the colors of the gantt bars. You can also show dependencies between tasks.

You can select the weekly timeline to visualize the important phases and tasks in your strategic planning process.

In the above example, each block denotes a week duration. Each colored block denotes whether the work is going on or not. You can also match the colored box with the Task Description to know which task is going on.

You can also optimize the Gantt chart, density of the weeks in the chart and thickening the Task bars to polish the weekly timeline.