
Setup Gantt Timeline
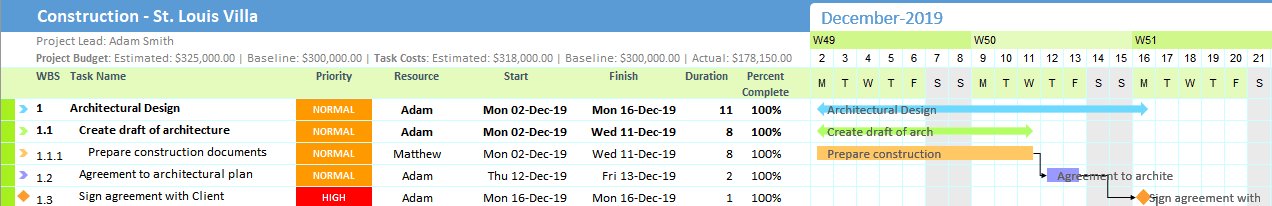
In addition to the grid portion of the template, the Gantt timeline view also provides an illustrated version of your task list, with Gantt bars that show the duration of your project’s tasks across a timeline. For each task, the associated Gantt bar begins at the start date and ends at the finish date.
Notes:
- Gantt bars are displayed using the start and finish dates for the tasks in your project.
- Task completion percentage is added as an overlay over the Gantt bars. This visually communicates the progress of the tasks.
The timeline can be viewed in six different views: Daily, Weekly, Monthly, Quarterly, Half-yearly and Yearly view. This feature is particularly useful for lengthy projects.
Daily View
Weekly View
Monthly View
Quarterly View
Half-Yearly View
Yearly View
Setup Timeline
Gantt Excel allows you to set the start date of the timeline and the end date of the timeline.
All views will then use these dates to render the timeline.
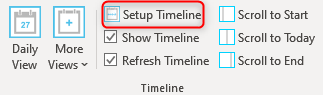
1 – Click on Setup Timeline in the Gantt menu in the Excel Ribbon.
2 – Set the Start Date and the End Date.
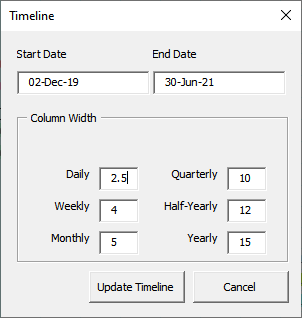
3 – Set the column width of each view if you would like to change it. Click the Update Timeline button once done. The timeline will now be redrawn based on the dates.
Note: If you set the timeline to only 1 column then we will default it to 2 columns so that the view is drawn correctly.
Scroll to Start
Click on the Scroll to Start button to reset your timeline dates to the start of the project. Gantt Excel automatically calculates the earliest start date among all tasks and then sets that date as the Start Date of the Timeline.
Scroll to Today
Click on the Scroll to Today button to reset your Start Date of the Timeline to Today’s Date (week start date of today’s date).
Scroll to End
Click on the Scroll to End button to reset your timeline dates to the end of the project. Gantt Excel automatically calculates the last end date among all tasks and then sets that date as the Start Date of the Timeline.
Watch this video tutorial on "How to Setup the Gantt Timeline"
Show Timeline & Refresh Timeline
Show Timeline
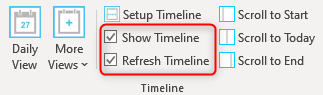
You can uncheck the Show Timeline checkbox in the Gantt Ribbon to hide the timeline.
This is useful if you only want to see or print the task data.
Refresh Timeline
You can uncheck the Refresh Timeline checkbox in the Gantt Ribbon to set the Refresh Timeline to Off temporarily.
This is particularly useful when you have hundreds of tasks and each action takes time. You can turn it off and update all your task data quickly and then turn it back on when done.