Project Costs
The process of managing project costs is an activity for estimating costs, developing a project budget and controlling spending.
Project Costs
Our Gantt chart excel template allows users to track costs and expenditures for projects and tasks.
To best track costs, you should first create a budget by creating and entering cost values for resources that are assigned to the project.
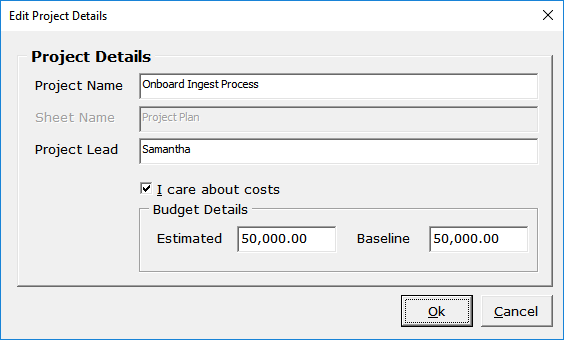
While creating a new Gantt chart worksheet you will be able to enter the budget costs associated with the project.
When the Ok button is clicked the newly created Gantt chart will show the project info along with the cost information on the left top corner of the sheet.
Note:
- You can edit the project information at any time by double-clicking the project name and the edit project popup will open up.
- The Actual costs are automatically calculated by summing up all the actual costs of the tasks.
Task Costs
Tasks are associated with three cost fields that can be used for planning and to track actuals.
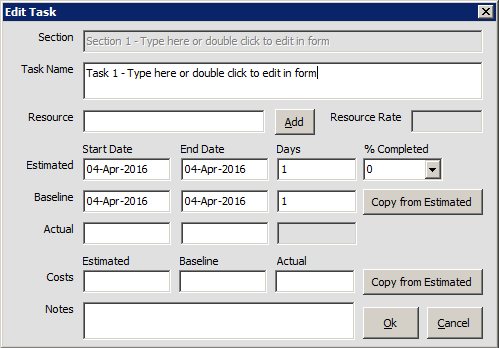
- Estimated Cost – The sum of planned costs of all expenses estimated for the task
- Baseline Cost – When the ‘Copy from Estimated’ button is clicked the Estimated cost entered is saved into the Baseline.
While the estimated cost may change often, the baseline cost should not be changed ideally. It gives the stakeholders a fair idea as to how much the task was originally supposed to cost. - Actual Cost – The actual cost of the task should be entered after the task is completed.
Viewing cost data in the grid
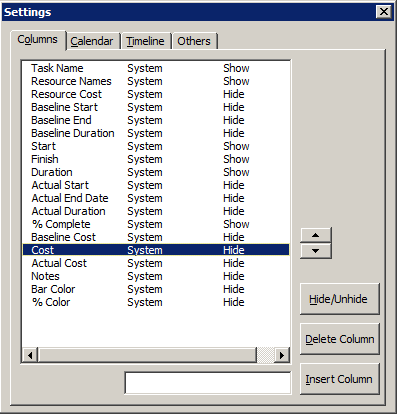
To view the Cost columns in the grid you can un-hide the columns by clicking on the Settings icon in the Gantt tab and then un-hiding the required cost columns in the columns tab.
Tasks are also associated with Resource Cost. You can set resource cost by clicking on Add in the task form popup (see screenshot below) or by clicking the Resources button on the Gantt tab.
Resource Costis an auto-calculated field and is calculated based on Resource Cost per day * Duration of a task in days.
To view the Resource Cost column you can un-hide the column by clicking on the Settings icon on the Gantt tab and then un-hiding the column in the columns tab.
Project Dashboard
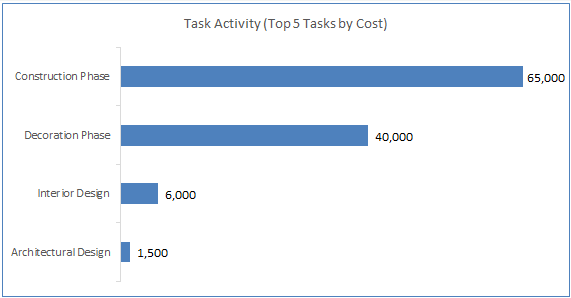
The project dashboard provides a high-level summary of the project costs. By monitoring cost variances regularly, you can take steps to make sure that your project stays close to its budget.
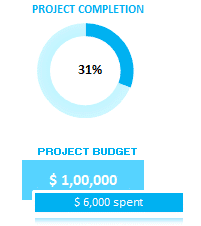
This first screenshot tells us that the project is 31% complete and the project budget was set to $1,00,000 and that $6,000 has already been spent on it.
This second screenshot tells us that the sum of all tasks – baseline costs was set to $97,500 and that the estimated costs were probably revised from the originally set 97,500 to 1,12,500. It also tells us that $6000 has already been spent.
This third screenshot summarizes the high-level tasks of the project by estimated costs.
