
Open the Gantt Chart Template
Download the Gantt Chart Excel template if you haven’t done so already. Open the template.
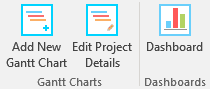
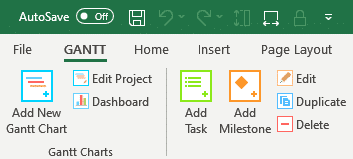
The Gantt Menu tab in the excel ribbon will instantly load (see image below).

- Create a New Gantt Chart
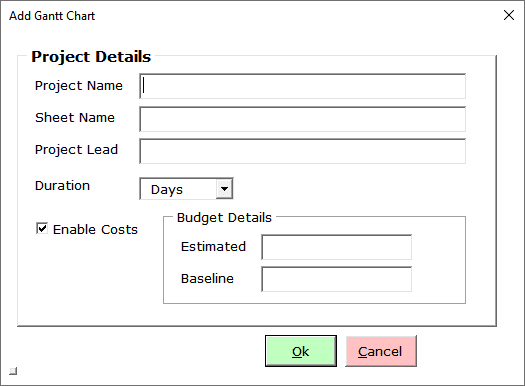
Click on the Add New Gantt Chart button to bring up the Project Details window.

Enter the Project Name, Worksheet Name, Project Lead and the Estimated/ Baseline Budget for the Project.
You can also use Gantt Excel to track project budget and task costs.
Click the Ok button when done.
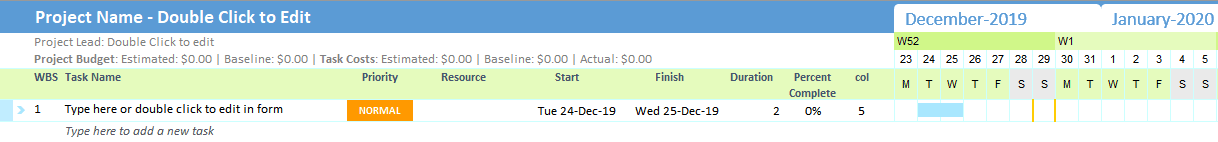
A new Gantt chart with an integrated timeline is automatically created for you. By default, a task is added with the start date set to today.

- Add Tasks
Gantt charts only provide value when they include all the necessary tasks and milestones for project completion. To begin, list all activities as tasks. Gantt Excel offers three convenient ways to add tasks.
Method 1: Type directly in the excel grid. If you type a task where it says “Type here to add a new task“, it will automatically create a new task with default start and end dates and the timeline will instantly update.
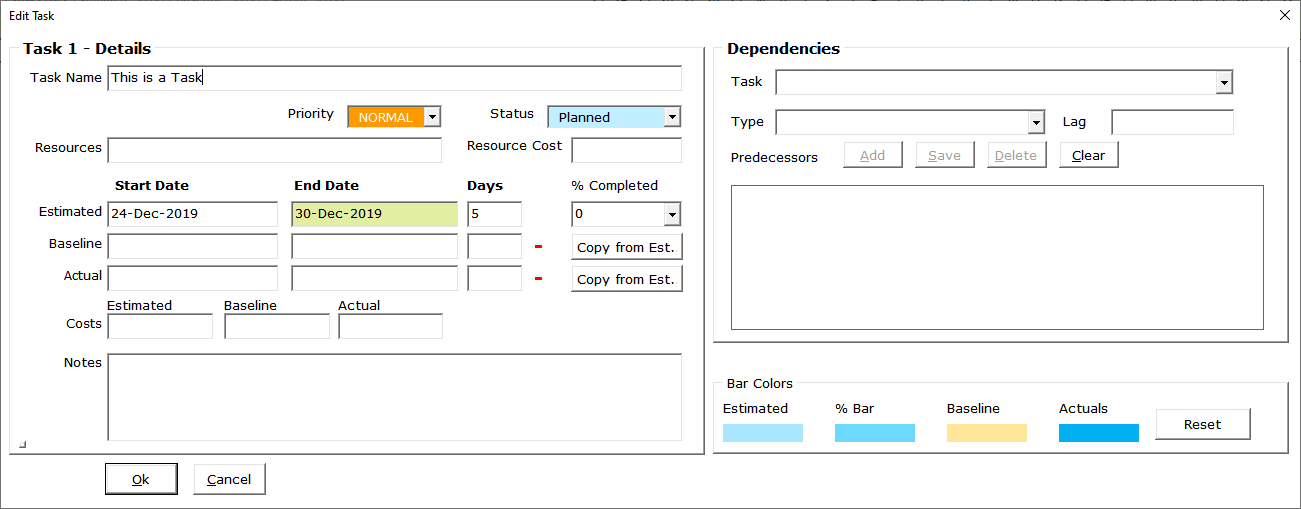
Method 2: Click the Add Task button on the Gantt tab

The task details form will open up. The task details form allows you to input all relevant task information, including resources, estimated, baseline, and actual start and end dates. It also tracks costs—estimated, baseline, and actual—making it an excellent tool for budget and cost planning. Additionally, you can add task notes to provide a brief description, clarify the task’s purpose or scope, and share important details with everyone involved.

Click the Ok button when done. The newly added task will show up in the excel grid with all the details.
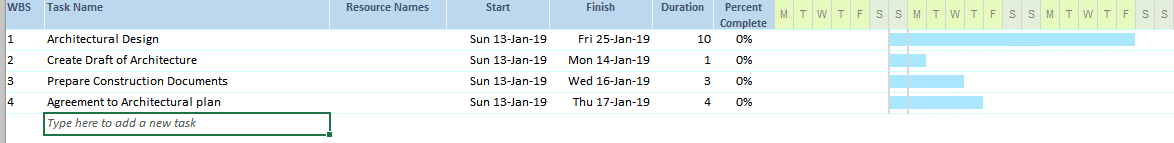
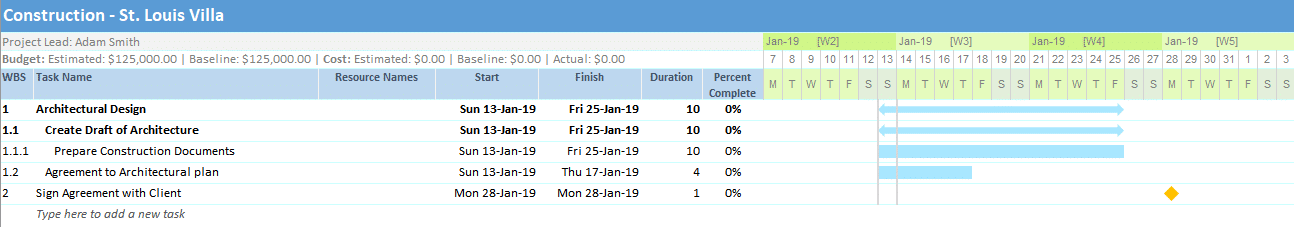
Go ahead and add a few tasks as in the example below and set the start and finish dates.

Importantly, note that the Work Break Structure (WBS) is automatically calculated and set for you.
- Set Parent and Child Tasks
If a task is large and involves multiple users with different skill sets, break it down into subtasks and establish parent-child relationships for more effective management.
To set parent-child relationships, select a task that you want to convert to a child task and click on the Make Child button.

Shortcut – Alt + Right arrow key
To create a parent task from a child task click on the Make Parent button.

Shortcut – Alt + Left arrow key
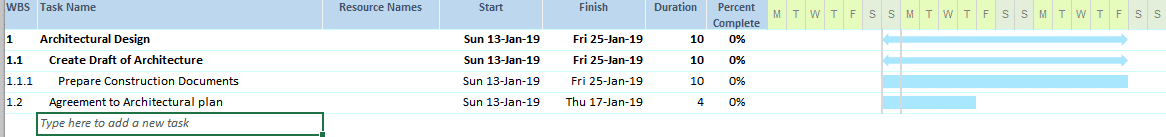
As a result, when you group child tasks together under a parent, values such as dates, costs etc. aggregate and roll up to the parent task.
This is how the tasks look when I set a few tasks as child tasks.
- Add Milestones
Milestones help your team stay on track and to more accurately determine whether or not your project is on schedule.
To add a milestone click on the Add Milestone button on the Gantt Menu.

This will bring up the Add Milestone details window. Enter the milestone details and click the Ok button when done.
To illustrate, see the example below. The milestone (diamond-shaped symbol) shows up in the timeline.
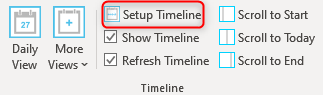
- Setup Timeline
Click on the Setup Timeline button in the Gantt Menu.

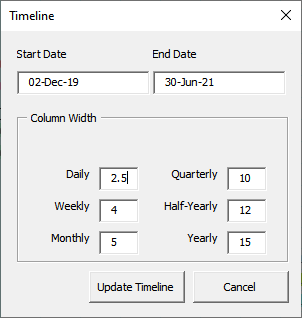
Set the Start and End Date of the timeline and click the Update Timeline button.

Gantt Excel will automatically update and recreate the calendar timeline based on the selected dates.
- Setup Gantt Chart Resources
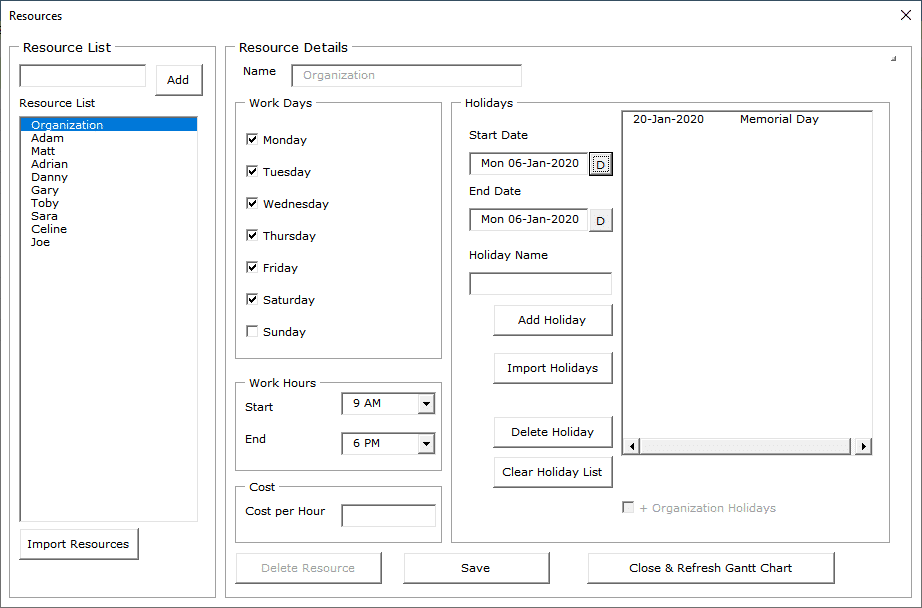
Click on the Resources button in the Gantt Menu.
You can create unlimited resources and assign them to tasks. Additionally, you can add holidays and non-working days in the Resource window, and these will be factored into the calculation of task end dates.
The holidays will also be highlighted in the Gantt Timeline.
- Gantt Chart Excel Settings
Equally important is setting up the Gantt chart correctly. Let’s explore all the settings screens and go through each one step by step.
Click on the Settings icon in the Gantt Menu.
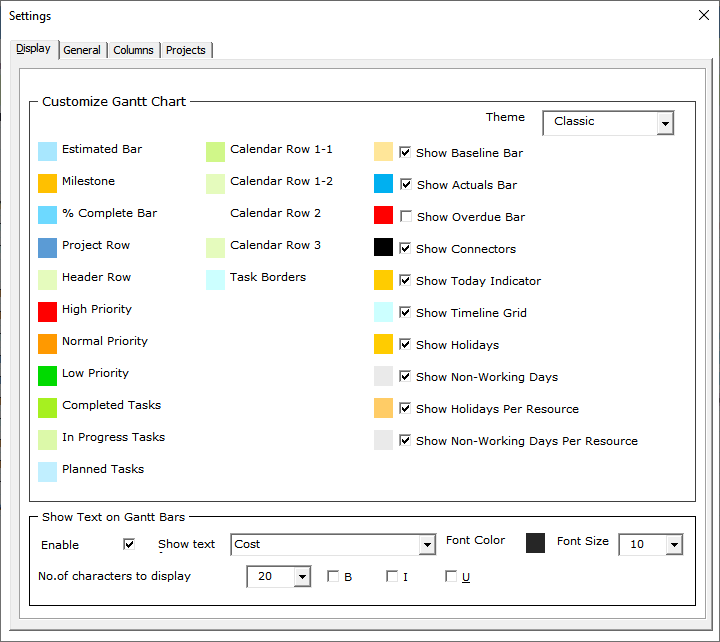
Display Settings
By default, the Display tab opens up first. Here you can set the general theme colors including the different timeline bar and milestone colors.
You can also choose to show additional timeline bars for baseline, actual dates and the overdue bar for all overdue tasks.
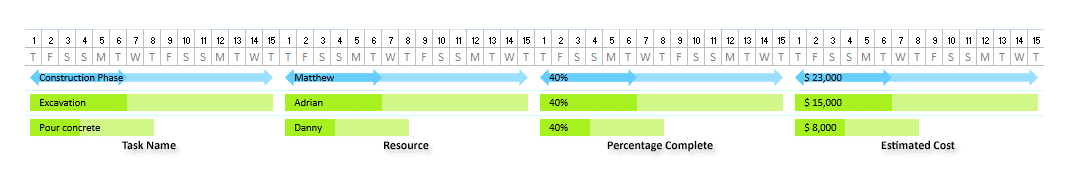
Lastly, one of the most sought out features is to show text within the Gantt Bars. You can check the Enable Text Display option and select any text from any column to show within the Gantt bars.

This is how it looks when the Show Text in Gantt Bars is enabled. We think it is one of the finest features of Gantt Chart Excel.
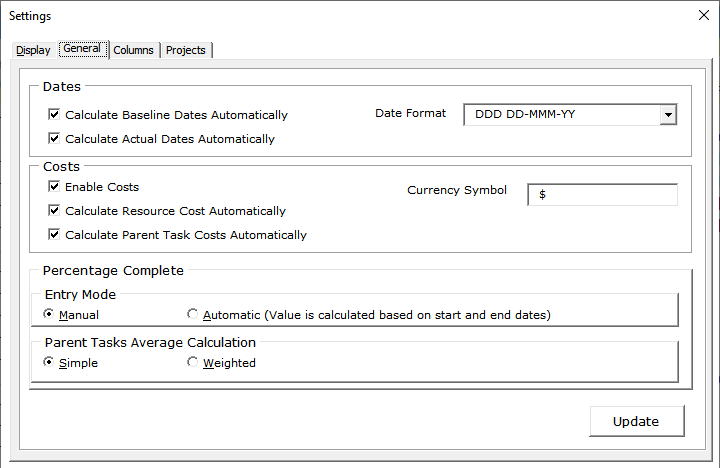
General Settings
Switch over to the General tab to setup cost and date calculations, currency symbol, and the Date format.
Additionally, you can define how the Percentage complete is calculated for the tasks. You can use the Manual or Automatic mode for entry and use Simple or Weighted calculation for the Parent task roll-up calculation.
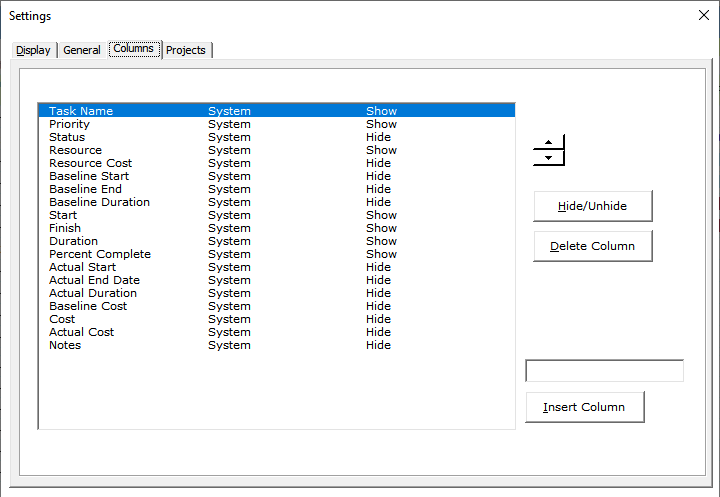
Columns Settings
Finally, we have the columns tab where you can hide or unhide existing columns. You can also insert up to 20 custom columns.
From here you can easily customize the Gantt chart by changing timeline colors, and adding various details like percent complete, costs etc… As shown below, with some tweaks you can create a timeline that’s sure to impress.


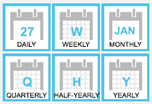
In conclusion, the beauty of Gantt Excel lies in its versatility, offering seven calendar views to choose from: Hourly, Daily, Weekly, Monthly, Quarterly, Half-Yearly, and Yearly.