
What is a Gantt Chart and why is it important? A Gantt Chart is the most important tool used in Project Management and is one of the most popular and useful ways of showing activities (tasks or events) displayed against time.
In simple words, a Gantt chart is a visual view of tasks scheduled over time.
A Gantt chart is constructed with a horizontal axis representing the total time span of the project, broken down into increments (for example, days, weeks, or months) and a vertical axis representing the tasks that make up the project.

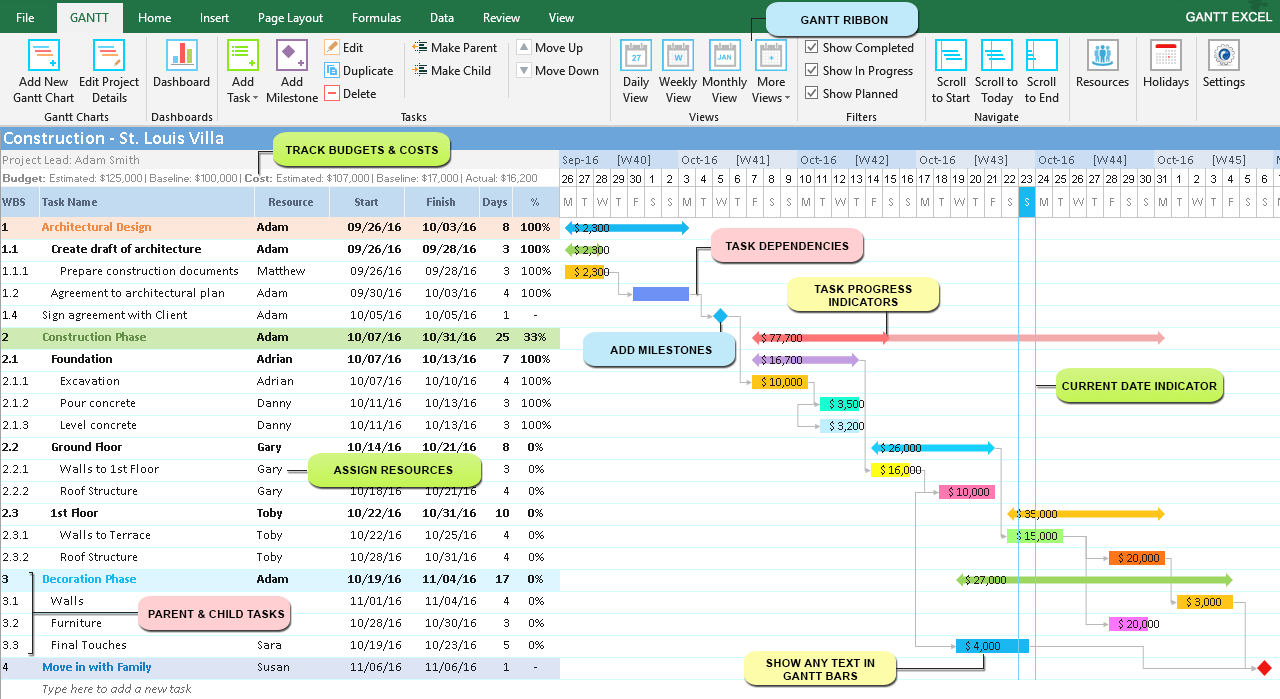
The above image is an example of a Gantt chart created to plan the construction of a villa.
On the left side of the gantt chart, you’ll find a list of project tasks and milestones and on the top right you will see the calendar timeline.
The above example is an actual screenshot of Gantt Excel. It’s the most intuitive and easy way to build a gantt chart quickly, right within Excel.
A Gantt chart represents projects or tasks in the form of cascading horizontal bar charts. It illustrates the breakdown structure of the project by showing the start and finish dates as well as various relationships between project activities, and in this way helps you track the tasks against their scheduled time or predefined milestones.
In the simplest terms, a Gantt Chart is nothing but a timetable or a timeline that is useful for planning and scheduling projects. Lets explore this in detail:
Gantt charts make it easy to understand the steps required for a project, thus enhancing organization and improving the chances of success.
One of the biggest benefits of a Gantt chart is the tool’s ability to boil down multiple tasks and timelines into a single document. Stakeholders throughout an organization can easily understand where teams are in a process while grasping the ways in which independent elements come together toward project completion.
Today, Gantt charts are commonly used for tracking project schedules. They help to show additional information about the various tasks or phases of the project, for example how the tasks relate to each other, how far each task has progressed, what resources are being used for each task and so on.
Gantt Charts convey very useful information at a glance
Gantt Charts convey very useful information at a glance
- When is the project starting?
- What the various tasks/ activities are?
- When each task or activity begins and ends?
- How long is each task planned to last?
- Who is working on the task?
- Which tasks overlap with other tasks, and by how much?
- The estimated and baseline budget for the project
- The estimated, baseline and actual costs for the project
- Project Milestones
- The final finish date of the project
History of Gantt Charts
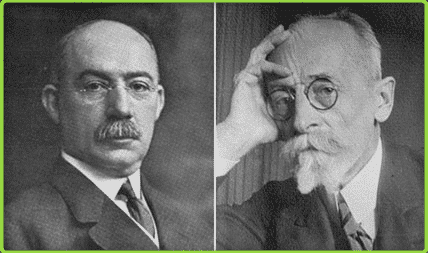
The first Gantt chart was created and devised in the mid 1896 by a Polish engineer named Karol Adamiecki. He was a Polish engineer and ran a steelworks in southern Poland. Karol had become interested in management ideas and he developed techniques to display processes visually so that he could make it easier to see production timelines. He called his work the Harmonogram and published his articles in Russian and Polish but the English-speaking world didn’t know much about his work.
Some 15 years after Adamiecki created the Harmonogram, Henry Gantt, an American engineer and management consultant, had the same idea and devised his own version of the gantt chart. In 1910, Henry Gantt started planning schedules with bar charts which allowed allowed his supervisors in the steel works to see if productions was on track or behind schedule. It was this planning chart that became widely known and popular in western countries. Consequently, it was Gantt’s name that became associated with charts of this type.
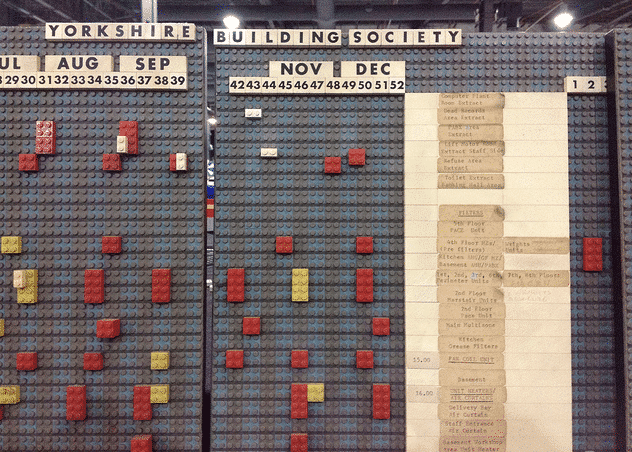
Originally Gantt charts were prepared laboriously by hand. Each time a project changed it was necessary to amend or redraw the chart and this limited their usefulness, the continual change being a feature of most projects.
Most people used to plan on paper (imagine that!) or with colored blocks. For eg. Magnetic blocks and Legos™ were commonly used to plan projects prior to the advent of Gantt chart software. Nowadays, however, with the advent of Gantt Chart Templates and an array of online tools, Gantt charts can be created and updated easily.
Gantt Chart Softwares
Once the era of computers set in, project managers found they could save time in creating and updating their Gantt charts. Gantt chart software, also called project management software, project planning, or project scheduling software was created to automate the process to support more advanced Gantt requirements like creating task dependencies, adding milestones or identifying the critical path of a project.
Nowadays Gantt Chart software fall into two broad categories:
Desktop Programs
- Microsoft Project
Microsoft Project is the world’s most popular project management software developed and sold by Microsoft. Microsoft project released its first version over 30 years ago and is one of the most used tools by Project Managers. However, the software has a few drawbacks as it is too advanced for beginners and there’s quite a learning curve to master the software. While it has a lot of advanced features it also has a wide range of unused and pointless features as well. Added to this is the pricing, it is one of the most expensive project management software out there. - Gantt Excel
Gantt Excel is one of the best and easiest tools to create Gantt Charts. Everyone pretty much has a copy of Microsoft Excel on their computers and almost everyone is pretty familiar with the most loved version of spreadsheets.
Gantt Chart Excel is a robust completely automated and feature-rich software that’s a breeze to use. It is loaded with helpful features, without being bloated with unnecessary bells and whistles. Highly recommend this to new and experienced project managers as well.
Online Tools
Many project managers traditionally used local desktop programs like Microsoft Project—and many still do. But today, Gantt chart software has moved online, enabling anyone to create simple Gantt charts and projects plans. However most are not secure and there are huge risks of project data security.
Gantt Chart Software Features
Here are some of the key features that you will need to get the most out of your Gantt software.
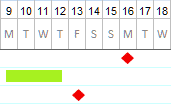
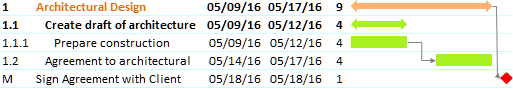
Milestones
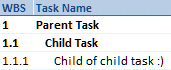
Parent & Child Tasks
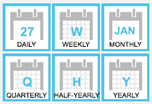
Calendar Views
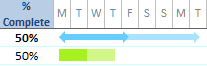
Task Progress
Task and Milestone Dependencies
Why Use Gantt Charts to Plan Projects?
To successfully complete a project, you must control a large number of tasks and ensure that they’re completed on schedule. If you miss a deadline there could be drastic effects on the rest of the project. This may result in project delays and cost a lot more. That’s why it’s helpful to be able to see everything that needs to be done, and know, at a glance, when each activity needs to be completed.
Gantt charts convey this information visually. They outline all of the tasks involved in a project, and their order, shown against a timescale. This gives you an instant overview of a project, its associated tasks and milestones, and when these need to be finished.
When you set up a Gantt chart, you need to think through all of the tasks and milestones involved in your project. As part of this process, you’ll work out who will be responsible for each task, how long each task will take, and what problems your team may encounter.
This detailed thinking helps you ensure that the schedule is workable, that the right people are assigned to each task, and that you have workarounds for potential problems before you start.
They also help you work out practical aspects of a project, such as the minimum time it will take to deliver, and which tasks need to be completed before others can start. Plus, you can use them to identify the critical path – the sequence of tasks that must individually be completed on time if the whole project is to deliver on time.
Finally, you can use them to keep your team and your sponsors informed of progress. Simply update the chart to show schedule changes and their implications, or use it to communicate that key tasks have been completed.
Who Uses a Gantt Chart?
Today, nearly everyone uses a Gantt chart to help them visualize their projects and tasks. All the difficult calculations are now done by computer algorithms, so anyone can just create a simple task list, add start and end dates, and the gantt chart software does the work instantly of displaying your tasks over time.
Gantt Chart Users by Role
Gantt charts are effective project management tools for these roles:
- CEOs & CTOs
- General Managers
- Project Managers
- Team Leaders
- Operations Managers
- Scheduling managers
- Work Managers
- Marketing Managers
- … and literally, anyone who wants an instant snapshot of a project timeline.
Gantt charts used to be the exclusive tool of formally trained project managers. These were people planning long-range projects of all different types: manufacturing, construction, engineering, military, IT and more. Creating long task lists, dependencies and complex schedules with lots of moving parts, required training in the art and science of task estimation, planning dependencies and so on.
While still considered the domain of project managers, today with the wide range of project management and Gantt chart software tools, anyone might be found to be using Gantt charts.
Gantt Chart Users by Team
With the advent of collaborative Gantt chart applications like Gantt Chart Excel, more and more teams use Gantt Charts to plan and track all kinds of work together. Gantt charts can be used by all kinds of teams, such as:
- Project Management Teams
- PMOs
- IT & Dev Teams
- Marketing Teams
- Professional Services Teams
- Engineering & Architectural Teams
- Construction Teams
- Public Works Teams
- Manufacturing Teams
- Product Development Teams
- Remote Teams
- Government Teams
- Telecommunications Teams
- Healthcare Teams
- Software Development Teams
- Oil & Gas Industry teams
The trend earlier was to have a single project manager leading a single team for a single project, but now, many people across the organization manage projects with multiple teams of people.
Nowadays, teams are required to plan tasks/ activities and manage resources in multiple projects across different teams. It’s vital to ensure that the Gantt chart tools you choose can support task and resource management effectively to ensure that your project is completed successfully.
Create a Gantt Chart
If you use Microsoft Excel, you can create a Gantt Chart/ Project Timeline/ Schedule with almost no learning curve by downloading our Gantt Chart Excel Template. Excel is widely used everywhere, so everyone on your team “gets it” and hits the ground running. Our Gantt Chart template is completely automated, and it is super easy to use. Download it now, and you’ll have a professional-looking Gantt chart in minutes.
Once you’ve downloaded our template, follow these critical steps.
Step 1: Identify Essential Tasks
Gantt charts are not useful unless they include all of the tasks/ milestones needed for a project or project phase to be completed.
So, to begin, list all of the activities as tasks. Use a work breakdown structure if you need to establish what the tasks are.
Then, for each task, set start date and its estimated duration. The end date will be automatically calculated for you based on the workdays and holidays that you have set.
Step 2: Plan Milestones
Life is full of milestones – and so are projects. When planning a project, it is vital to mark all critical dates along the way. Milestones help your team stay on track and achieving the milestone dates keeps ensures that your project is on schedule.
Incorporating milestones in your gantt chart helps you and your team keep sight of:
- Key Dates – Launch parties, board meetings, product rollouts, program kickoff, and other key dates mark significant milestones in your project. It’s also helpful to include other one-day events unrelated to your project specifically that are still important for your team to keep in mind – like a group offsite or team holiday.
- Key Deadlines – Key deadlines are essential to surface on large project plans so your team can easily see what’s coming up and plan accordingly. For example, the date that website development is completed or product release dates.
Use key deadlines as milestones to reflect when a key task is completed.
- External Dates and Deliveries – For example, a due date for a deliverable you are expecting from an agency, the date when your product is scheduled to be delivered. These key events can affect when other tasks in your project are allowed to start. They may also be used as predecessors in your plan.
Step 3: Chart Progress
As your project moves along, it will evolve. For example, in our scenario, if quality assurance of core material revealed a problem, then you may need to delay production until the issue is resolved.
Update your chart to reflect changes as soon as they occur. This will help you to keep your plans and the stakeholders up to date.
Gantt Excel - Free Gantt Chart Excel Template
Create Professional-looking Gantt Charts in Excel
Gantt Chart Excel Template is completely automated and is super easy to use.
If you use Microsoft Excel, you can create a Gantt Chart with almost no learning curve by downloading Gantt Excel.
Microsoft Excel is instantly familiar, so everyone on your team “gets it” and hits the ground running.
Gantt Excel gives you the ability to see every step of your project from beginning to end.
Our Gantt Chart Excel software lets you visualize every project step. You can create tasks and link them using dependencies, and then track their progress against deadlines and milestones.