
Gantt Chart Excel – How to Create a Gantt Chart in Excel
Step-by-Step Tutorial for Making a Gantt Chart in Excel
We all love Microsoft Excel and we use it almost every day for everything – from a simple calculator to tracking massive projects. There’s just one thing that Excel is not good at and that is creating Gantt charts. For this reason, we created Gantt Excel, an automated excel template that allows you to create professional-looking Gantt Chart in Excel.
Microsoft Excel is instantly familiar and widely used, so everyone on your team “gets it” and hits the ground running.
Before we begin, what is a Gantt Chart?
A Gantt chart is a type of bar chart, adapted by Karol Adamiecki in 1896 and independently by Henry Gantt in the 1910s, that illustrates a project schedule. It is a graphical illustration of the duration of tasks against the progression of time. Gantt charts are useful tools for planning and scheduling projects.
Gantt Chart Example
Here are the steps to create Gantt Charts in Excel
-
Download our Free Gantt Chart Template

Save the excel template to your Desktop or your My Documents folder. Note, our template works in Excel 2007, Excel 2010, Excel 2013 and Excel 2106 on Windows and Excel 2016 on the Mac. -
Open the Gantt Chart Template
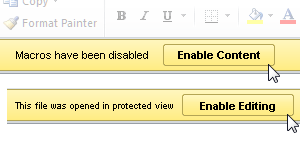
Click on the Enable Macros & Enable Editing button. Note that there is no installation. It’s just a simple excel template and it opens just like any other excel file.

The Gantt tab in the excel ribbon will instantly load.
-
Create a New Gantt Chart
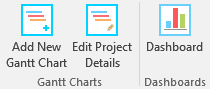
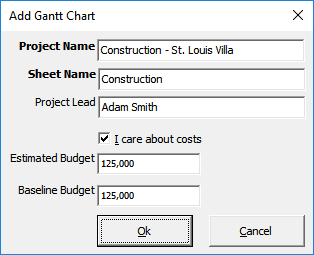
Click on the Add New Gantt Chart button to bring up the Project Details window.

Enter the Project Name, Worksheet Name, Project Lead and the Estimated/ Baseline Budget for the Project.

Click the Ok button when done. A new Gantt Chart is automatically created for you. You don’t have to bother about setting up complicated conditional formatting or creating any graphs.
Everything is automated and that’s the best part.
-
Add Tasks
Gantt charts don’t give useful information unless they include all of the tasks/ milestones needed for a project to be completed.
So, to start, list all of the activities as tasks. There are three ways to add tasks in Gantt ExcelMethod 1: Type directly into the excel grid. If you type a task where it says “Type here to add a new task“, it will automatically create a new task with default start and end dates and the timeline will instantly update.
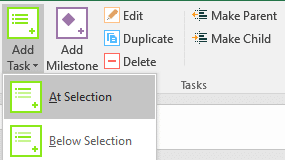
Method 2: Click the Add Task button on the Gantt tab

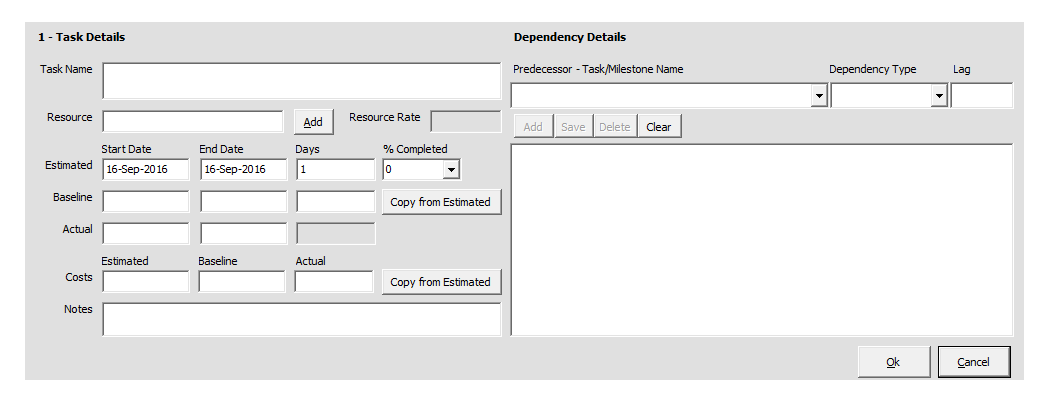
The task details form will open up where you can enter all the task details including task resource, estimated, baseline, actual – start and end dates. You can also keep track of costs including estimated, baseline and actual costs, therefore making it an excellent budget and costs planner.
Task notes can also be captured to include a short description of your task to clarify its purpose or scope and to provide additional info to everyone involved.
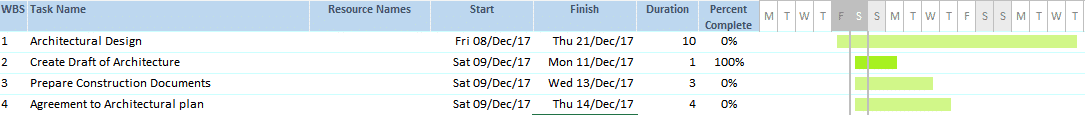
Click the Ok button when you are done. The newly added task will show up in the excel grid with all the details.Go ahead and add a few tasks like in the example below and set the start and finish dates.

Importantly, note that the Work Break Structure (WBS) is automatically calculated and set for you.
-
Set Parent and Child Tasks
If a task is relatively large and requires several users with different skills to manage, break the task into subtasks and create parent-child relationships.
To set parent-child relationships, select a task that you want to convert to a child task and click on the Make Child button.

Shortcut – Alt Right arrow keyTo create a parent task from a child task click on the Make Parent button.

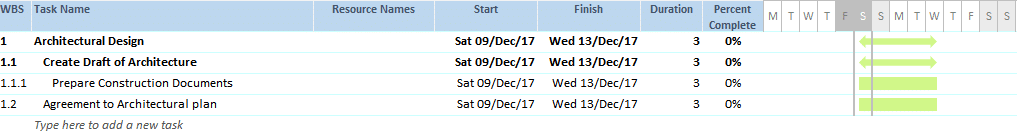
Shortcut – Alt Left arrow keyAs a result, when you group child tasks together under a parent, values such as dates, costs etc. aggregate and roll up to the parent task.
This is how the tasks look when I set a few tasks as child tasks.

-
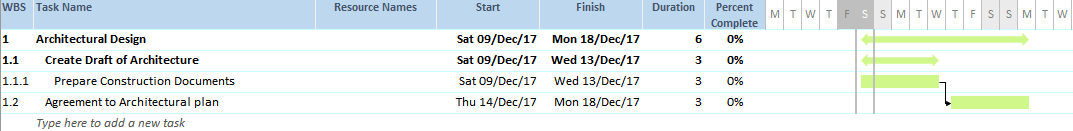
Set Task Dependencies
Setting dependencies between tasks is the most powerful feature of Gantt Excel. The in-built auto-scheduling automation of the template is able to update the dates based on changes made to its dependent tasks.
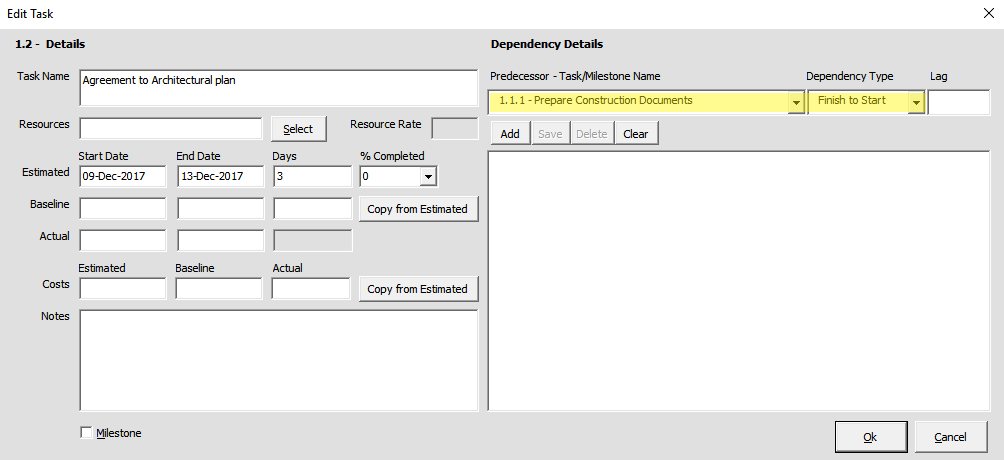
To Add task dependencies double–click task 1.2. This will open up the Edit Task Details window.

In this example, we are setting 1.1.1 as the predecessor task with a Finish to Start dependency. Click Add and then Ok to confirm.
This basically means that this task can start only when task 1.1.1 finishes. Also, notice how the taskbar in the timeline moves automatically after the end date of the predecessor task.

Click here to read more about task and milestone dependencies.
-
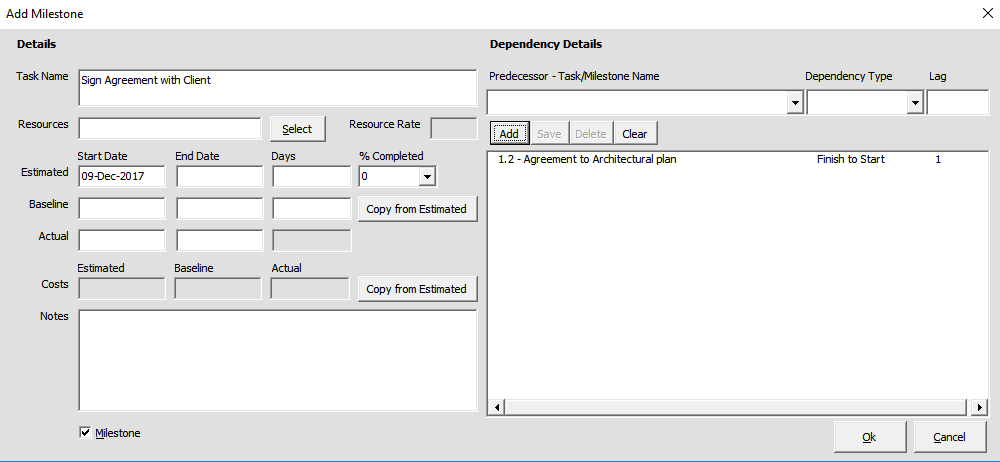
Add Milestones
Milestones help your team stay on track and to more accurately determine whether or not your project is on schedule.
Use a key deadline as a milestone to reflect when a section of tasks or key task is completed.To Add a Milestone click on the Add Milestone button in the Gantt tab.

This will bring up the Add Milestone details window. In this case, I’m setting this milestone to be dependent on task 1.2 with a Finish to Start dependency with a lag of 1 day. Click Ok when done.

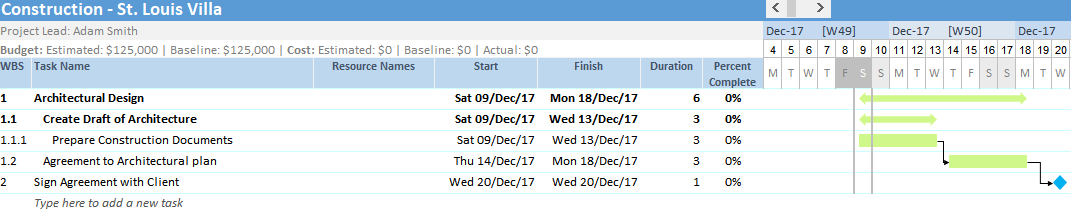
To illustrate, see the example below. The milestone and a diamond-shaped symbol appear in the timeline.


Gantt Excel Settings
Equally important, is to set up the Gantt chart correctly. Let’s look at all the settings screens and go through them one by one.
Click on the Settings icon in Gantt tab.
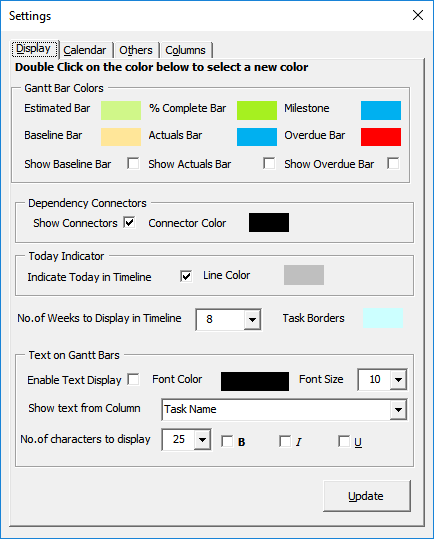
Display Settings
By default, the Display tab opens up first. Here you can set all the different timeline bar and milestone colors.
You can also choose to show additional timeline bars for baseline, actual dates and the overdue bar for all overdue tasks.
If you want to see more of the timeline then you can increase the “No of weeks to display in timeline” setting.
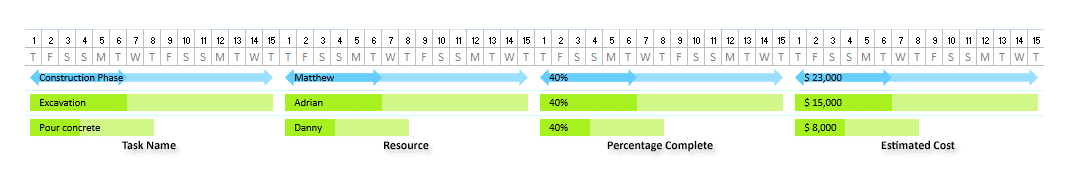
Lastly, one of the most sought out features is to show Text within the Gantt Bars. You can check the Enable Text display option and select any text from any column to show within the Gantt bars.
This is how it looks when the Show Text in Gantt Bars is enabled. We think it is one of the finest features of Gantt Excel.
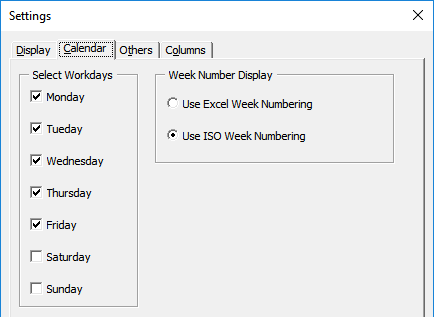
Calendar Settings
The calendar tab is where you can select Workdays. You can also select the way the week numbers are calculated by either using Excel’s week calculation or use the ISO week calculation.
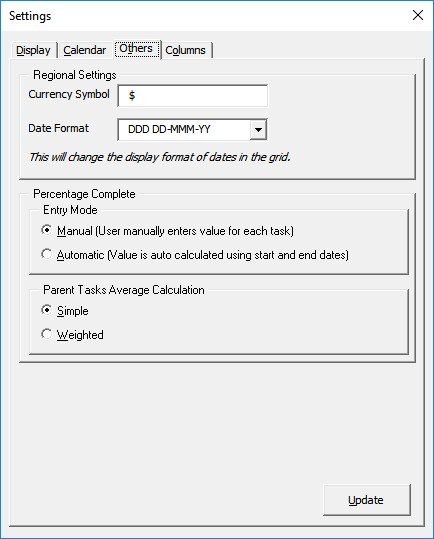
Other Settings
Switch over to the Others tab to set Currency symbol and Date format.
Additionally, you can define how Percentage complete is calculated for the tasks. You can use the Manual or Automatic mode for entry and use simple or weighted calculation for the Parent task roll-up calculation.
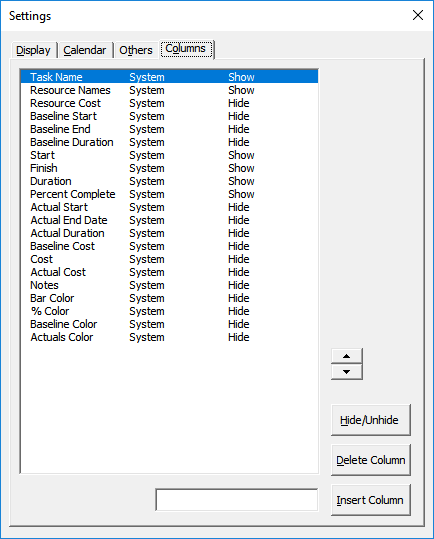
Columns Settings
Finally, we have the columns tab where you can hide or unhide existing columns. In like manner, you can also insert your own custom columns or delete them if required.
Gantt Excel – The Smart Way to Plan
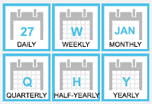
In Conclusion, the beauty of Gantt Excel is we have six calendar views to choose from namely Daily, Weekly, Monthly, Quarterly, Half-Yearly and Yearly View.
From here you can easily customize the Gantt chart by changing timeline colors, and adding various details like percent complete, costs etc… As shown below, with some tweaks you can create a timeline that’s sure to impress.

Gantt Chart Excel Template – Download Now
It is the best free Gantt chart software out there.