
Construction Gantt Chart in Excel
A construction programme you can actually hand to a client: phases, trades, dependencies and the milestone dates everybody asks about. It is an Excel workbook, so nobody has to learn anything new.
Runs in Microsoft Excel. Nothing to install, no account.

01 What a construction Gantt chart looks like
On site most people call it a bar chart. In project software it gets called a Gantt chart. They are the same drawing: every task is a row, the calendar runs across the top, and each task is a bar sitting under the days it occupies. Nothing more complicated than that.
Here is the groundworks phase of the Oakfield Villa build, the project the Gantt Excel documentation follows from first task to printed report.
| WBS | Task | Trade | Start | Finish | Days |
|---|---|---|---|---|---|
| 2 | Groundworks | Tue 08-Sep-26 | Mon 14-Sep-26 | 6 | |
| 2.1 | Site clearance | Groundworks | Tue 08-Sep-26 | Wed 09-Sep-26 | 2 |
| 2.2 | Excavate foundations | Groundworks | Thu 10-Sep-26 | Fri 11-Sep-26 | 2 |
| 2.3 | Pour footings | Concrete Crew | Sat 12-Sep-26 | Mon 14-Sep-26 | 2 |
A six-day working week, Monday to Saturday. Row 2 is a phase heading and nothing on it was typed by hand.
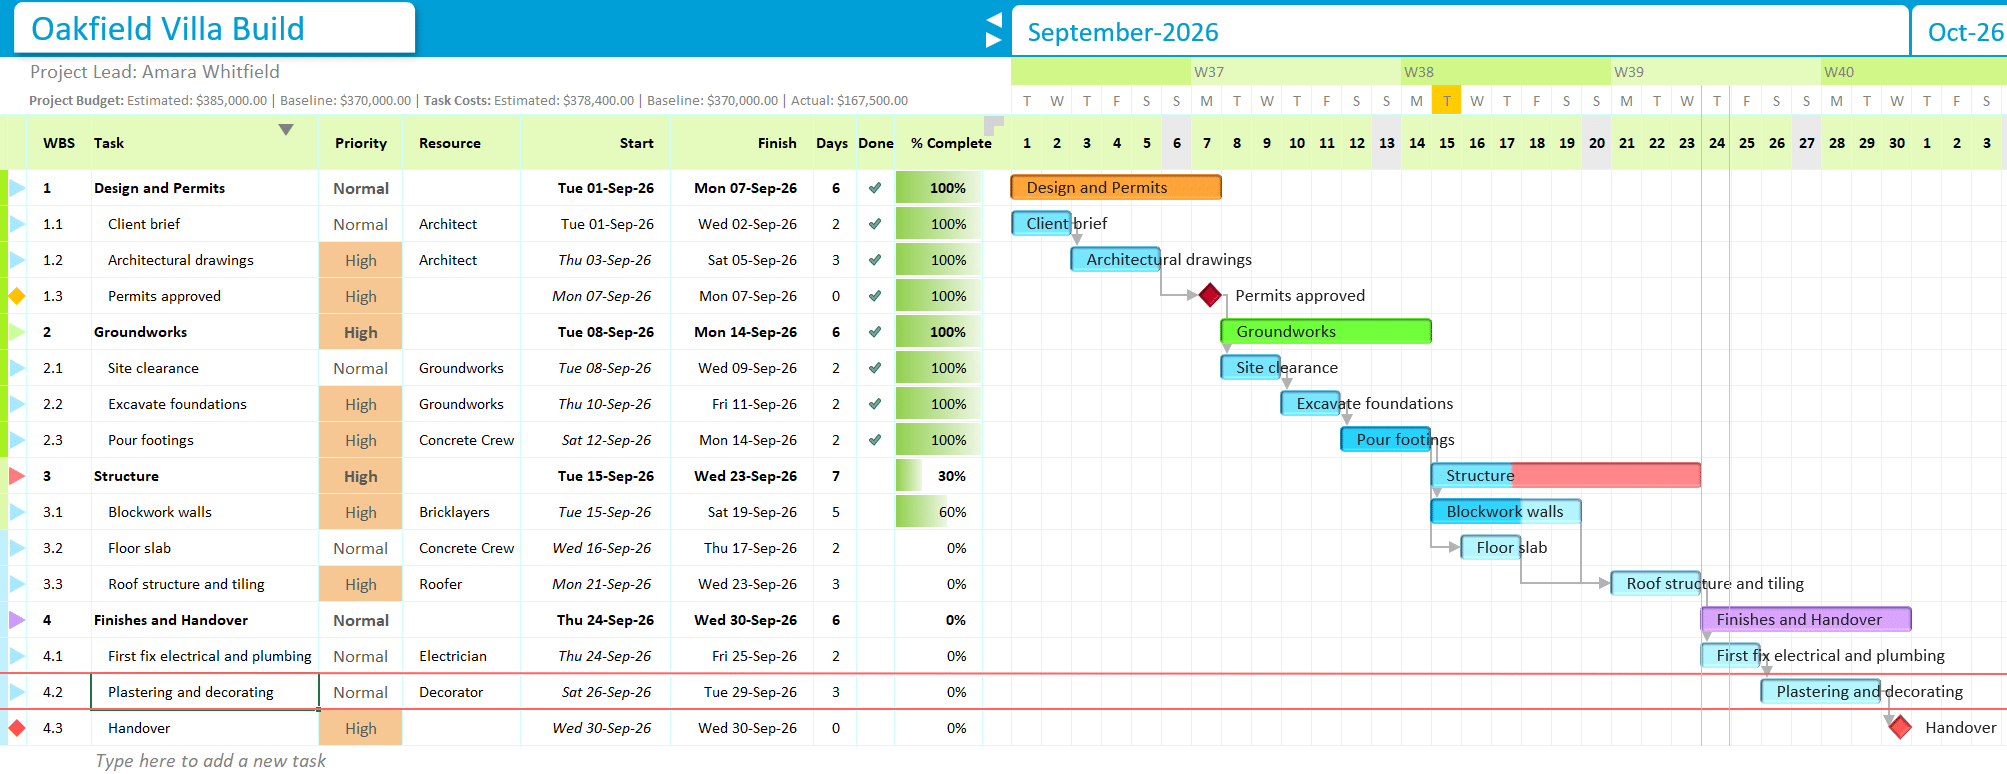
The whole build in the workbook. Phases in bold, tasks indented under them, the trade against each one, and the bars drawn from the dates.
Row 2 was not typed. Its start is the earliest of the three tasks under it, its finish is the latest, and its six days are the three durations added up. Change any task beneath it and that row rewrites itself.
Now look at the footings. Two days of work, and they run from Saturday the 12th to Monday the 14th. Sunday the 13th is not a working day on this job, so the task steps over it, and the phase still reads six days of work rather than seven. Nobody counted that by hand and nobody will have to count it again when the pour moves.
This is the argument for drawing a programme rather than listing tasks. A list tells you the groundworks take six days of labour. The chart tells you which six days, whose crew is on site for them, and what happens to the date when one of them is lost to weather. Those are the three things a client, a subcontractor and a quantity surveyor are actually asking about.
02 Build it in phases first, then drop the trades underneath
Forty tasks in a flat list is unreadable and impossible to report on. Group them the way you would describe the job out loud. Enabling works. Groundworks. Structure. Roof and envelope. First fix. Second fix and finishes. Then put the real tasks under each one.
You never create a phase heading directly. You create it by indenting the task underneath it, which is why the button you reach for is Make Child rather than Make Parent. The row above becomes a summary and starts doing the adding up for you, exactly as row 2 did in the table above. Its start is the earliest child start, its end is the latest child end, and by default its progress is a duration-weighted average of the tasks under it, so a two-day task finishing does not drag a ten-day task’s phase along with it.
The WBS numbers on the left come with it. 2.3 is the third task in the second phase, which is how you talk about it in a meeting and how it prints on a report. Full detail is in Summary tasks, indenting and the WBS.
A summary row is a mirror, not a plan. Its dates, duration, progress and costs are recalculated from the tasks beneath it every time one of them moves, which is why those fields are locked when you open one. If a phase looks wrong, the answer is always in the tasks under it.
03 Link the tasks, and one slipped day moves everything after it
This is the part that makes a programme worth keeping rather than worth redrawing. Footings cannot be poured before the drainage is in. Say so once, and the schedule holds that rule for the rest of the job.
Four link types are available, and on a building job you will use the first two for almost everything:
| Type | Reads as | The rule | On site |
|---|---|---|---|
| FS | Finish to Start | B starts after A finishes | The default. Footings after drainage. |
| SS | Start to Start | B starts when A starts | Scaffold going up as the frame goes up. |
| FF | Finish to Finish | B finishes when A finishes | Occasional. Snagging closing with handover. |
| SF | Start to Finish | B finishes before A starts | Rare. |
Lag is where construction differs from most industries, and it is the setting people forget. Concrete needs curing time. Screed needs drying time. Render needs weather. You write the wait into the link rather than padding the task, so the programme shows seven days of curing as seven days of curing and not as a suspiciously long pour.
Now the payoff. The rip-out on a fit-out runs a day over:
| Task | Planned | After one day lost |
|---|---|---|
| Rip out old units | Mon 6 – Tue 7 July | Mon 6 – Wed 8 July |
| Fit kitchen units | Wed 8 – Fri 10 July | Thu 9 – Mon 13 July |
| Seal and grout | Mon 13 July | Tue 14 July |
One date was changed. The other two moved themselves, and the weekend was skipped without anyone counting it.
Change the one date you know about and the rest of the run follows. That is the difference between a programme you update on a Friday afternoon and a programme you quietly stop updating in week three. More on link types, lag and the errors Excel will refuse to accept is in Task dependencies, and there is a worked project on the Excel Gantt chart with dependencies page.
Once the chain is in, the critical path tells you which of those tasks have no slack at all. On a build that list is usually short and always worth knowing, because it is the only set of tasks where a lost day is a lost day on the handover date.
04 Only some delays cost you the handover date
Not every lost day matters equally, and knowing which ones do is most of what an experienced planner is doing when they look at a programme.
Run the links through the job and one chain of tasks turns out to decide the finish date. That is the critical path. If anything on it slips, the handover slips with it. Everything off it has some room to move first, and that room has a name: float, also called slack.
On the villa the chain is outlined in red, and the number written into each bar is that task’s float. Almost every bar says zero. One does not.
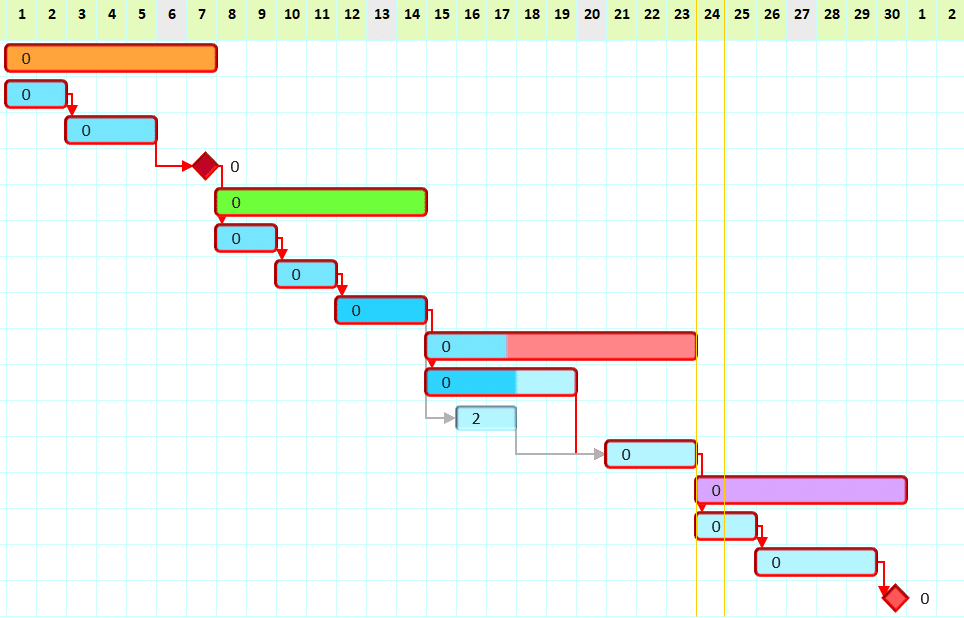
Every bar carries its own float. The one reading 2 is the floor slab.
| Task | Trade | Dates | Float | On the critical path? |
|---|---|---|---|---|
| Blockwork walls | Bricklayers | Tue 15 – Sat 19 Sep | 0 | Yes |
| Floor slab | Concrete Crew | Wed 16 – Thu 17 Sep | 2 days | No |
| Roof structure and tiling | Roofer | Mon 21 – Wed 23 Sep | 0 | Yes |
Both the walls and the slab are released the same day, when the footings are finished. The roof waits for both. But the walls take five days and the slab takes two, so the slab can run two days late and the roof still starts on Monday the 21st. The blockwork cannot slip by a single day without moving the handover.
That is a useful thing to know at eight o’clock on a Tuesday morning when the concrete crew ring in and say they are short-handed. Same phone call, different answer depending on which trade is making it.
Now look again at those two start dates. The walls start on Tuesday the 15th and the slab starts on Wednesday the 16th, even though nothing is holding the slab back. The 15th is a company holiday. The concrete crew observe it and the bricklayers do not, and each trade carries its own working calendar, so the schedule simply knew. Nobody typed either date.
Float is worked out from your own numbers — durations, links and each trade’s calendar — and it is recalculated every time anything changes. It is not a judgement you make once and write down.
05 Milestones are the dates the client actually asks about
Nobody rings to ask how the second fix carcassing is going. They ask when the building will be watertight, and whether you are still on for the date in the contract.
A milestone is a zero-duration marker that answers exactly that. It shows as a diamond rather than a bar, it prints cleanly on a one-page summary, and it gives the rest of the programme something honest to hang off. Electrical first fix should not wait on the whole structure phase. It should wait on the building being closed in, and in the villa build three trades hang off a single Watertight milestone for that reason.
Because a milestone is a single date, only the two link types that drive a start date are offered on one: Finish to Start and Start to Start. The two that drive an end date are not, since on a milestone the start and the end are the same day. Milestones covers how to mark one and where they appear in reports.
06 Some days need planning by the hour, not by the day
A build runs for months, so its programme is measured in days. One line on that programme reads Kitchen fit-out, 4 days and that is the right grain for it.
The fitting day itself is a different problem. Units at 08:00, worktops after lunch, plumber booked for 15:00, electrician needing the worktops in before he can do anything. Days are far too coarse a unit to plan that in, and it is exactly the day that goes wrong and costs you a return visit.
So plan it as its own chart, measured in hours. Same idea, finer grain: tasks, links, durations, a timeline. The difference is that the timeline is a working day rather than a calendar, and durations are hours against each trade’s shift.
Here is the strip-out on a kitchen refit, planned to the hour:
| WBS | Task | Trade | Start | Finish | Hrs |
|---|---|---|---|---|---|
| 1 | Strip out | Tue 11-Aug 08:00 | Wed 12-Aug 09:00 | 9 | |
| 1.1 | Isolate services | Electrician | Tue 11-Aug 08:00 | Tue 11-Aug 09:00 | 1 |
| 1.2 | Rip out old units | Fitter | Tue 11-Aug 09:00 | Tue 11-Aug 14:00 | 4 |
| 1.3 | Remove old worktops | Fitter | Tue 11-Aug 14:00 | Tue 11-Aug 16:00 | 2 |
| 1.4 | Clear debris | Labourer | Tue 11-Aug 16:00 | Wed 12-Aug 09:00 | 2 |
The electrician is booked for one hour at the start, and nobody else can touch anything until he has been.
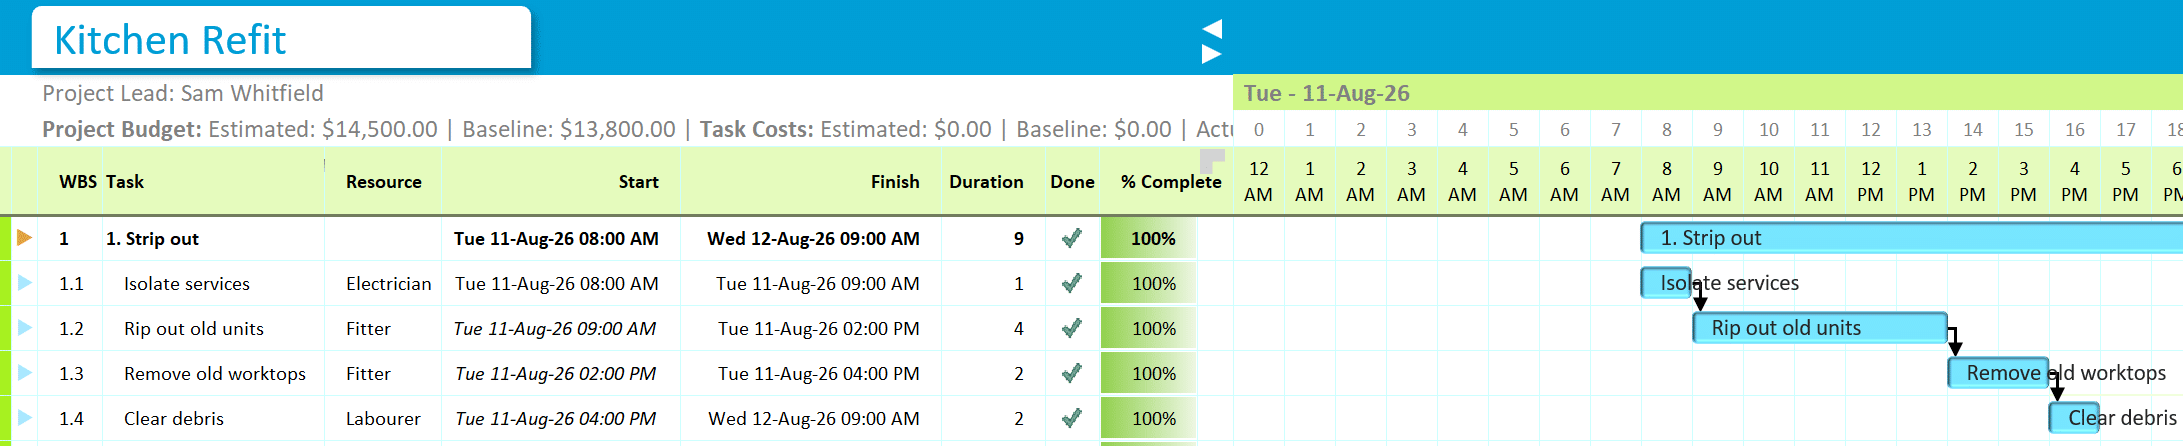
Look at Clear debris. Two hours of work starting at four in the afternoon, finishing at nine the next morning. The day ends at five, so one hour happens on Tuesday and the second happens first thing on Wednesday. Written on a daily programme that task would have said “1 day” and told you nothing about whether the skip is going on Tuesday night.
The one thing people get wrong here, every time. Days-or-hours is a property of the chart, decided once when you create it, and it cannot be converted afterwards. It is not a zoom level. You can view an hourly chart on a daily timeline and a daily chart on a monthly one whenever you like — that is just how wide the columns are. What you cannot do is turn a chart that was built in days into one that schedules in hours.
So on a build, the programme is a daily chart and the pour day, the crane lift, the road closure or the fit-out day are separate hourly charts. Not one chart trying to be both.
The detail on working windows, overnight shifts and what changes at that grain is in Planning by the hour, and there is a ready-made hourly template if you want to start from one rather than build it.
07 What you promised, against what actually happened
This is the section that earns its keep when a job goes sideways, and it is the one most people skip until they wish they had not.
Every task holds three sets of dates rather than one. The baseline is the plan you agreed to, frozen. The estimated dates are the plan as it stands today. The actual dates are what really happened. Freeze the baseline the day the programme is signed off and you never have to argue from memory again.
Here is the first fortnight of the villa, plan against reality:
| Task | Planned | What actually happened |
|---|---|---|
| Architectural drawings | Thu 03 → Sat 05 Sep | Thu 03 → Mon 07 Sep |
| Permits approved | Mon 07 Sep | Tue 08 Sep |
| Site clearance | Tue 08 → Wed 09 Sep | Wed 09 → Thu 10 Sep |
| Excavate foundations | Thu 10 → Fri 11 Sep | Fri 11 → Wed 16 Sep |
| Pour footings | Sat 12 → Mon 14 Sep | Sat 12 → Mon 14 Sep |
You can read the whole fortnight off that. A day lost on the drawings pushed the permits, which pushed the site clearance. Then the excavation ran three days over on its own account — bad ground, most likely — and the concrete crew pulled the footings back onto the planned dates. Nobody had to remember any of it.

The upper bar on each task is the plan. The lower one is what happened. On the excavation, the second is visibly longer than the first.
That is the difference between saying “we lost some time early on” and showing which task, on which dates, and by how much. The same three bands carry the money as well as the dates, so cost slippage reads exactly the same way.
Without a baseline, a programme quietly rewrites itself every time you update it, and by month four nobody can say what was originally agreed. Baselines and actuals covers setting one, re-baselining after an agreed variation, and reading the gap.
08 Keep one company schedule above the individual jobs
Most builders who plan properly still only plan one project at a time, and it is the reason two jobs end up wanting the same groundworker in the same fortnight.
Run a company schedule alongside the project programmes. It carries the summary line from every current and upcoming job, nothing deeper. It takes ten minutes a week to keep up and it answers questions the individual programmes cannot:
How far out are you booked?
The question that decides whether you chase the next tender or finish the one in front of you.
Where do two jobs collide?
Two projects reaching first fix in the same week is a problem you can see in March and not in June.
Where are the gaps?
Empty weeks between jobs show up as white space, early enough to sell into.
A practical order for building a project programme, once you have the company view:
- List the phases of the job before any individual task.
- Break each phase down into the tasks a trade would recognise.
- Set the milestones the contract and the client care about.
- Link the tasks, and put the curing and drying waits into the links as lag.
- Publish it, in whatever format the person reading it will actually open.
- Review it with the site team weekly, and push the changes up into the company schedule the same day.
09 Costs sit on the same rows as the programme
On a construction job the schedule and the budget are the same argument. A week of delay is a week of prelims, and a plan that tracks dates without tracking money tells you half the story.
Costs are held at two levels. The project carries an estimated budget and a baseline. Each task carries its own estimated, baseline and actual cost, and the phase rows roll those up the same way they roll up the dates. So you can open a programme and see that Groundworks was set at one number, quoted at another, and has so far spent a third, without leaving the file the dates live in.
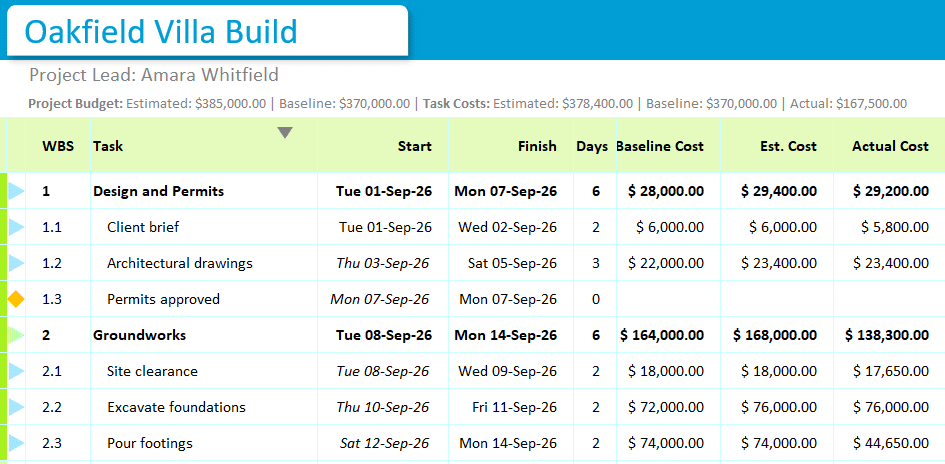
Read the Groundworks row. Agreed at $164,000, carried at $168,000 once the excavation was repriced, and $138,300 actually spent so far. The four-thousand difference between the first two numbers is the extra excavation you can see overrunning in the section above. The dates and the money are the same conversation.
The strip along the top does the same for the whole job: estimated $385,000 against a baseline of $370,000, with $167,500 spent to date.
The project dashboard then summarises it on one sheet, which is the sheet to put in front of a client rather than the programme itself. Work and costs has the detail, and there is a separate project budget planner if the money side is what you came for.
10 Five ways a construction programme stops being used
Most programmes are not wrong. They are abandoned. Usually for one of these reasons, and all five are avoidable.
It was drawn at the wrong grain
Two hundred rows on a six-month build means nobody reads it and nobody updates it. Plan to the level you can actually control: the phase, the trade, the week. If one day genuinely needs breaking down, give that day its own hourly chart rather than sixty more rows on the master.
Nothing was linked, so every update is an evening’s work
An unlinked programme is a picture of a plan. The first time a task slips you either retype forty dates or you stop updating. Links are the entire difference, and they take one pass to set.
The waits were hidden inside the tasks
Padding a pour from three days to ten because the concrete needs curing makes the programme lie about how much labour the task needs, and it hides the wait from anyone reading it. Put curing, drying and delivery lead times in as lag on the link. Then everybody can see what is work and what is waiting.
No baseline, so nobody can prove anything
Six weeks in, the programme reflects reality and has quietly forgotten what was agreed. That is the moment an extension-of-time conversation becomes a matter of opinion.
Only one person could open it
A programme that lives in software the site manager does not have, or behind a licence the client will not buy, ends up as a PDF printed in March and pinned up in September. This is the honest case for planning in Excel rather than against it: everyone already has it, and the file is yours.
And the honest concession. If several people need to edit the same programme at the same time, all day, from different sites, a spreadsheet is the wrong tool and a proper multi-user planning platform is the right one. A workbook is for one person who owns the programme and shares it out. That covers most builders, and it does not cover everybody.
11 The words on a programme, in plain English
Every one of these turns up on a construction schedule, in a tender document or in a delay claim. If you are new to planning, this is the vocabulary; if you are not, it is the version to send someone who is.
| Term | What it means on site |
|---|---|
| Bar chart | A Gantt chart. Older name, still the normal one in the trade. |
| Phase / summary task | A heading row — Groundworks, Structure — that adds up the tasks beneath it. |
| WBS | Work breakdown structure. The numbering: 2.3 is the third task in the second phase. |
| Predecessor | The task that has to happen before this one. |
| FS, SS, FF, SF | The four ways two tasks can be linked. Finish to Start is the common one. |
| Lag | A deliberate wait built into a link. Curing, drying, delivery lead time. |
| Float / slack | How long a task can slip before it starts pushing the finish date. |
| Critical path | The chain of tasks with no float. Slip one and the handover moves. |
| Milestone | A zero-duration marker for a date that matters. Watertight, handover. |
| Baseline | The agreed programme, frozen, so you can measure against it later. |
| Actual dates | What really happened, recorded alongside the plan. |
| % complete | How far through a task is. Phases work it out from the tasks under them. |
Each of these has a guide of its own in the Gantt Excel documentation, worked through the same villa build.
12 Two finished programmes to look at first
Both are the villa build from the top of this page, exported from Gantt Excel on the day this was written. Open the PDF to see what lands in a client’s inbox, and the workbook to pull the plan apart and see how the dates hold together.
- Oakfield Villa build — PDFThe programme on this page, exactly as a client receives it.
- Oakfield Villa build — Excel workbookThe same programme with the tasks, links, float and costs still live.
Exporting to PDF, printing to a fixed paper size and sharing a read-only view are all covered in Export and print.
Common questions
Is a construction bar chart the same thing as a Gantt chart?
Yes. Bar chart is the older term and it is still the normal word on site in the UK, Ireland, India and much of the Middle East. Gantt chart is the same drawing under the name of the man who popularised it. If a client asks for a bar chart programme and a consultant asks for a Gantt chart, one file answers both.
Can I build a construction programme in Excel without a template?
You can, with a stacked bar chart and a hidden start-date series, and for a one-off picture to drop into a tender document it is a perfectly reasonable thing to do. The trouble starts on the second week. Nothing is linked, so every date you move you move by hand, and every date after it too. On a build with curing waits and trade sequencing that is an hour a week you will not keep spending. How to create a Gantt chart in Excel walks through the manual method and where it stops being worth it.
How do I show phases with tasks underneath them?
Type the phase name on a row, type the tasks below it, then indent the tasks. The row above becomes a summary and picks up the earliest start, the latest end, the rolled-up duration and the weighted progress from the tasks under it. You do not type anything on the phase row. See Summary tasks, indenting and the WBS.
What happens to the programme when a task runs late?
You change the one task you know about. Everything linked after it moves by the same amount, weekends and holidays are skipped, and the phase rows and the finish date update themselves. Nothing that is not linked to it moves, which is the point of setting the links honestly in the first place.
Can I send it to subcontractors who do not have the template?
Send the PDF. It is the format most site teams want anyway, it prints to a fixed paper size, and it needs nothing installed at the other end. If a subcontractor wants to work in the file itself they need the workbook, since the scheduling lives in it rather than in a server somewhere.
Does it handle costs as well as dates?
Yes, on the same rows. The project holds an estimated budget and a baseline, each task holds its estimated, baseline and actual cost, and phases roll their tasks up. The dashboard sheet summarises it for a client without showing them the whole programme.
What should a construction Gantt chart include?
At minimum: the phases of the work, the tasks under each phase with a duration and a responsible trade, the links between tasks, the waits built in as lag, and the milestones the contract names. Add a baseline once the programme is agreed. Anything beyond that — costs, resources, percentage complete — is useful but optional, and a programme with the first five is already more than most jobs run on.
How many tasks should a construction programme have?
As few as will let you see trouble coming. Plan to the level you can control, which on most builds means the trade and the week rather than the individual operation. If one particular day needs breaking down to the hour, give that day its own chart rather than adding sixty rows to the master. A two-hundred-row programme that nobody updates is worth less than a forty-row one that gets looked at every Friday.
Is a construction schedule the same as a construction programme?
In practice, yes. Programme is the usual word in the UK and much of the Commonwealth, schedule is the usual word in the US, and they describe the same document. You will also hear it called a works programme, a build programme or a bar chart programme. None of them mean anything different.
Can I plan a single site day by the hour instead of by the day?
Yes, as a separate chart. The build programme stays in days; a pour day, a crane lift, a road closure or a fit-out day gets its own chart measured in hours, with each trade’s working window and breaks taken into account. The one rule to know is that days-or-hours is fixed when the chart is created and cannot be converted afterwards, so decide before you start rather than halfway through.
Start your programme
Open it in Excel, type your phases, indent the tasks and link them. The dates take care of themselves after that.
Runs in Microsoft Excel. Nothing to install, no account.