
Baselines & actuals
A baseline freezes the plan you agreed to; the Actual dates record what really happened. Together they answer the one question every project sponsor asks — “are we late, and by how much?”
Every task in Gantt Excel carries three sets of dates, not one. The Task Form guide introduces them as a tour of the form; this page is the working method — how to set a baseline, how to fill in actuals as the job runs, and how to read the gap between the two. Examples use the Oakfield Villa build that runs through these guides, on a Monday–Friday working week.
01 Why a baseline is worth the click
Without a baseline, a plan quietly rewrites its own history. A delivery slips, you push the dates out, and the chart shows every task sitting neatly on its bar again — the project looks perfectly on schedule, because the schedule moved to meet it. You have lost the only thing that made the delay measurable.
A baseline is a frozen copy of the plan, taken at a moment you choose — normally the day the plan is signed off. It does not move when the schedule reflows, it takes no part in dependency calculations, and it never affects the critical path. That inertness is the entire point: it is a yardstick, and a yardstick that stretched would be no use.
02 The three bands, and which one does what
The same three fields — Start Date, End Date and Duration — appear once per band on the Task Form, and each band answers a different question.
“When do we currently think this will happen?”
The live plan. These are the dates that drive the main Gantt bar, the dependency engine and the critical path. Change them and the schedule reflows.
On the sheet they are the Start, Finish and Duration columns.
“What did we originally promise?”
A snapshot, taken once and left alone. It drives nothing — no dependency uses it, no successor moves because of it. It only ever gets compared against.
On the sheet: Baseline Start, Baseline End and Baseline Duration.
“What really happened?”
History, filled in as the work runs. It schedules nothing by itself — but entering an actual date prompts you to copy it onto the Estimated band, which does (section 05).
On the sheet: Actual Start, Actual End and Actual Duration.
The Baseline and Actual bands do not behave quite like the Estimated one, and the difference catches people out. Even in the Estimated band the Start Date is the one field you can never leave out: you give it a start, plus either an end date or a duration, and it works out the one you left blank. An end date and a duration on their own never produce a start — you are asked for one instead.
In the Baseline and Actual bands, Duration is derived, never an input: fill in the start and end and the duration is worked out for you from the resource’s working calendar, so a baseline running Monday to Friday reads as 5, not 7. Try to type into Baseline Duration, on the form or in the column, and Gantt Excel says why it will not take it — Baseline Duration is read-only. This field is auto-calculated. To enable manual entry, turn off automatic calculation in the Settings window.
Actual Duration gives you the same answer in its own words. That setting is section 09; until you change it, the two dates are the whole input.
One exception, and it saves you a step: on a milestone, a Baseline Start or Actual Start on its own is enough. The matching end date is set equal to the start and the duration to 0, in every band — a milestone is a moment, so there is nothing else it could be.
03 Setting a baseline with Copy Est.
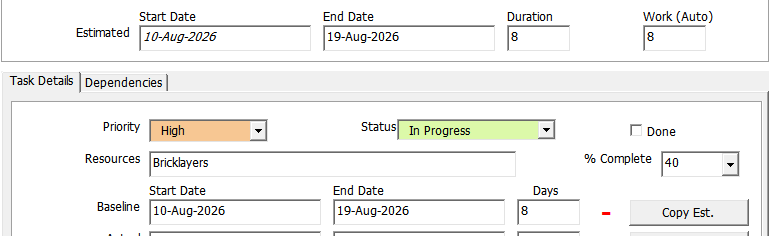
Almost every baseline starts life as a straight copy of the plan, so there is a button for it. Open the task and look to the right of the Baseline date boxes:
Double-click the task row to open the Task Form on that task.
Check the Estimated dates are the ones you actually mean to commit to. This is the moment to get them right — the copy is a snapshot, not a link.
Click Copy Est. beside the Baseline band. Start Date, End Date and Duration are filled in from the Estimated band in one go.
Click OK. Nothing is written to the sheet until you do.
You can also type baseline dates straight into the Baseline Start and Baseline End columns on the sheet, which is quicker when you are setting a baseline that differs from the plan — a date somebody negotiated you down to, for instance. Type the two dates only: Baseline Duration fills itself in from them, and anything you type there is replaced by the calculated figure.
04 Re-baselining, and clearing a baseline
Sometimes the original plan stops being a fair comparison — the client adds a room, the scope genuinely changes, and holding the team against a promise nobody makes any more is just noise. That is when you re-baseline: fix the Estimated dates, then click Copy Est. again. The new snapshot overwrites the old one.
To remove a baseline entirely, use the small clear glyph beside the Baseline date boxes on the form. It empties Start Date, End Date and Duration for that band in one action, leaving the Estimated and Actual bands untouched. Clearing the Baseline cost is a separate job — delete that figure yourself.
05 Recording Actual dates as work happens
The Actual band is a logbook. Fill in the Start Date the day the task genuinely begins, and the End Date the day it genuinely finishes — not the day you planned it to, and not the day you got round to updating the file.
For a task that has started but not finished, enter the Actual Start on its own and leave the rest empty — no end date is invented for you. When a task finishes exactly to plan, Copy Est. beside the Actual band fills the whole band in one click. Don’t reach for that button on a task that has merely started: it brings the estimated end date across too, and the task then claims to have finished on a day that has not happened.
A milestone is the exception, as it is for the baseline: an Actual Start on its own sets the actual end equal to it and the duration to 0. There is no half-finished state to record.
The sync question — read it before you answer
Type an Actual date and Gantt Excel will usually ask whether it should copy that date onto the Estimated band as well. Which question you get depends on what you have filled in:
| What you entered | What you are asked |
|---|---|
| Actual Start, no Actual End yet | Sync Actual Start Date to Estimated Start Date? |
| Actual Start and Actual End | Sync Actual dates to Estimated dates? |
| Actual End with no Actual Start | No sync question — and the end date is not kept either. The entry is refused with The End Date and Duration have been cleared. Please enter the Start Date first., and both cells are emptied. |
Answer Yes and the Estimated dates are overwritten with the actual ones — and because Estimated is the scheduling band, that does reflow the plan: successors move, the critical path is recalculated, automatic % Complete is recomputed. Answer No and only the Actual band changes; nothing else moves. You get the same question whether you type into the form or straight into the sheet columns.
The question never appears on a parent (summary) task, which takes its actuals from its children. Dependencies can silence it too, but only when there is nothing left to move: with both Estimated dates pinned by a link the sync is skipped without a word, and so it is when you have entered an Actual Start alone and the Estimated start is the pinned one. With just one of the two pinned you are still asked, and answering Yes syncs the half that is free — the other is left where the dependency put it, and you are told which. If the sync would produce an impossible range you are told rather than left guessing — for example Cannot sync: Actual Start Date is after Actual End Date. Please correct Actual Dates first.
Answer No and the Actual band is a record and nothing more. Its dates draw a bar and feed the comparison in the next section; they drive no dependency, and they play no part in automatic % Complete, which reads the Estimated start and end.
06 Reading slippage: Baseline against Actual
Here is the comparison doing real work. “Architectural drawings” was planned for Mon 29 June → Wed 1 July, three working days, and baselined the day the architect’s fee was agreed. The survey came back late, so nothing could start until the Wednesday, and two rounds of revisions doubled the drawing time.
| Band | Start | End | Duration |
|---|---|---|---|
| Baseline | Mon 29 June | Wed 1 July | 3 days |
| Estimated | Wed 1 July | Wed 8 July | 6 days |
| Actual | Wed 1 July | Wed 8 July | 6 days |
Estimated and Actual match here because the actuals were entered as they happened and the sync question was answered Yes each time — the plan was kept honest as the job ran. Read the result in three numbers, all in working days because that is how durations are counted:
- Started 2 days late — Mon 29 June to Wed 1 July.
- Finished 5 days late — Wed 1 July to Wed 8 July, with a weekend skipped.
- Took twice as long — 6 days against a baseline of 3.
That last line is the one worth arguing about. A late start is somebody else’s problem arriving on your doorstep; a doubled duration is the task itself being harder than anyone thought, and it is the number that should make you re-examine every similar task still to come.
Because the baseline never moved, those three numbers stay true for the rest of the project. Re-plan the Estimated dates as often as you like — the yardstick is untouched.
07 Cost slippage: the money version of the same question
Each band carries its own cost field as well as its own dates, and they work the same way. On the Task Form they sit under Costs, labelled Estimated, Baseline and Actual; on the sheet the columns read Est. Cost, Baseline Cost and Actual Cost.
| Field | Architectural drawings | What it is |
|---|---|---|
| Baseline Cost | £2,400 | The budget you signed up to |
| Est. Cost | £2,950 | What you now expect it to cost |
| Actual Cost | £3,010 | What the invoices came to |
Baseline against Actual gives a £610 overspend — and, read next to the five days of finish slippage above, tells you the delay cost roughly £122 a day. Two numbers that mean far more together than either does alone.
These are figures you type. The separate Resource Cost field is the calculated one — the assigned resource’s rate against the task’s duration — and it is covered in the Work, costs & budget guide.
08 Showing Baseline and Actual bars on the chart
Slippage is far easier to see than to read. Gantt Excel can draw a second and third bar on each task row — the baseline underneath the plan, the actual alongside it — so a late task looks late from across the room. Both are off until you switch them on, in Gantt Excel → Settings → Settings:
- Show Baseline Bars — draws the frozen plan as its own bar on every task that has baseline dates.
- Show Actual Bars — draws the recorded dates as their own bar.
Each bar has its own colour. Per task, the swatches are under Bar Colors on the Task Form; the sheet columns are Baseline Color and Actual Color. Project-wide defaults sit beside the two tickboxes in the same Settings dialog, and two things have to be true before one will open a colour picker. They are checked in this order, so the first thing you hear about is the first one that is wrong:
- The project theme must be CUSTOM. Checked first, whatever else is set. On any of the supplied themes these colours belong to the theme, and Gantt Excel answers
Set the theme to CUSTOM to change this color.
— see Colours & themes. - The matching bar must be switched on. Once the theme is CUSTOM, clicking the baseline swatch with the tickbox still clear gets you
Please enable Show Baseline Bars.
— there is no point colouring a bar nothing draws. The actual swatch says the same of Show Actual Bars.
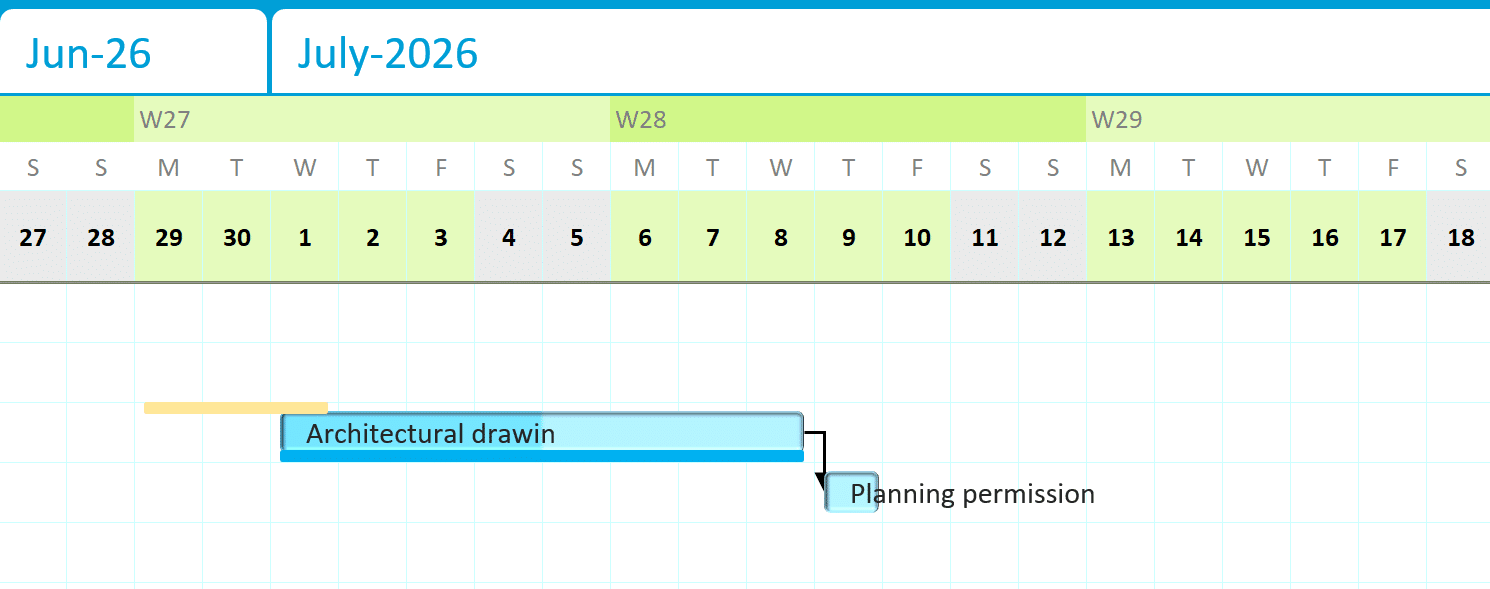
- Estimated bar. The live plan — the bar dependencies and the critical path follow.
- Baseline bar. Shorter and starting earlier: the original promise, frozen.
- Actual bar. The recorded dates, drawn to the same scale.
- The overhang. The distance the actual bar runs past the baseline is the slippage.
09 When the bands stop calculating themselves
By default the Baseline and Actual bands fill their own duration in: you give a start and an end, and the duration is worked out for you — which is why the duration field refuses to be typed into. Two settings can switch that off — Auto-calculate Baseline Dates and Auto-calculate Actual Dates, in Gantt Excel → Settings → Settings.
Turn one off and that band stops calculating and stops checking. The duration is no longer derived from the two dates, nothing is validated, and the fields will accept text as well as dates — occasionally useful for a baseline that was recorded as something other than a date. Turning off Auto-calculate Actual Dates also switches off the sync question in section 05, so actuals never touch the Estimated band again. Gantt Excel makes you confirm, and the warning is blunt about the trade: “manual entries can lead to inconsistent or inaccurate data.”
You can tell at a glance which mode a band is in: with auto-calculation off, that band’s three boxes on the Task Form are shown on a tinted background.
10 Common questions
Can I baseline the whole project in one go?
Why didn’t the next task move when I entered an Actual end date?
Sync Actual dates to Estimated dates?, and the Estimated band takes the new dates and everything downstream reflows. Answer No and nothing else moves. And if you were never asked at all, check the Actual Start — an end date entered on a row that has no actual start is not stored, so there was nothing to sync: you get
The End Date and Duration have been cleared. Please enter the Start Date first.and the cell is emptied. Put the start in first, then the end.
My baseline bars have disappeared. Where have they gone?
Should I re-baseline when the schedule slips?
How do I clear a baseline I set by mistake?
Why won’t the baseline fields on this task accept anything?
Related: The Task Form · Understanding % Complete · Work, costs & budget · Settings