
Views, timeline & zoom
The right-hand side of your chart is the timeline: a window onto a stretch of dates, drawn at whatever zoom you choose. This page covers every control that moves that window, changes its zoom, or resizes the grid around it.
Everything on this page lives in two sections of the ribbon: Views and Timeline, which decides which dates you are looking at and how finely they are divided, and Rows and Columns, which sets the size of the grid those dates are drawn in. They are separate settings and they never fight each other — one changes the picture, the other changes the paper.
01 A view is not a chart kind
This is the one thing worth getting straight before anything else, because almost every confusion about the timeline starts here.
“Does this project run in days or in hours?”
Fixed when you create the chart. A daily chart schedules in days; an hourly chart schedules in hours and minutes, and its tasks carry a time of day. Durations, working calendars and the whole scheduling engine follow this choice.
You cannot change it later. A project that needs both gets two charts.
“How wide is one column of the timeline?”
A display setting you change as often as you like, from the Views and Timeline section. One column can be an hour, a day, a week, a month, a quarter, a half-year or a year.
It changes nothing about your dates. Switch to Yearly View and back, and every task is exactly where it was.
The two are independent, and the interesting case is the crossover: an hourly chart can be shown in Daily View, and when it is, the bars are drawn by the daily renderer — one solid bar per task across whole day columns, not the hour-by-hour blocks you get in Hourly View. The underlying tasks still hold their times; you are simply looking at them from further away.
02 The Views and Timeline section
Here is the whole section. Hover or tap a pin to see what each control does — the numbered key below lists them all.
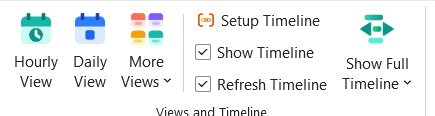
- Hourly View. One timeline column per hour. Appears on hourly charts only.
- Daily View. One column per day — the view most projects live in.
- More Views. A menu holding Weekly View, Monthly View, Quarterly View, Half Yearly View and Yearly View.
- Setup Timeline. The dialog that sets the window’s start and end dates, plus the column width used by each view.
- Show Timeline. A tickbox — untick it to hide the timeline band and all the bars.
- Refresh Timeline. A tickbox — untick it to pause automatic redrawing.
- Show Full Timeline. Sizes the window to the whole project so every bar is on screen.
- Scroll To. A menu: Scroll to Start, Scroll to Today, Scroll to End.
03 Choosing a view
Gantt Excel → Views and Timeline → Hourly View, Daily View, or More Views for the rest. There are seven in all:
| View | One column is | Good for |
|---|---|---|
| Hourly View | One hour | Shift work, installation days, anything planned to the hour |
| Daily View | One day | The everyday working view for projects of a few weeks or months |
| Weekly View | One week, Monday to Sunday | A quarter or two on one screen |
| Monthly View | One calendar month | A year or two — the usual view for a status report |
| Quarterly View | One quarter | Multi-year programmes |
| Half Yearly View | Six months | Long-range roadmaps |
| Yearly View | One calendar year | The whole thing at a glance |
Switching view redraws the timeline header, re-sizes the columns to that view’s width and redraws every bar against the new grid. Your dates are never touched. Nothing else on the sheet changes, so it is safe to flick between views as often as you like.
04 Setup Timeline — the window and the column widths
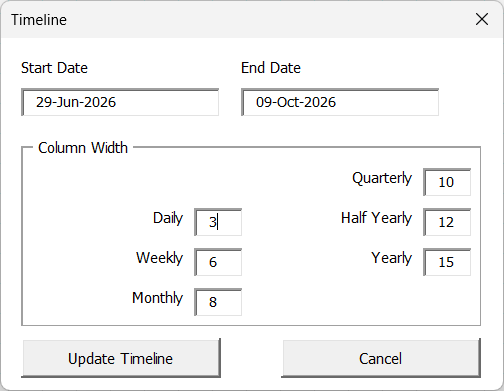
Gantt Excel → Views and Timeline → Setup Timeline opens a dialog titled Timeline that does two separate jobs.
The window: Start Date and End Date
These two dates are the stretch of calendar the timeline draws. They are not your project dates — a task can happily sit outside the window; its bar simply is not painted until the window reaches it.
Click either box and a date picker opens: you choose the date rather than typing it, which is why the boxes look read-only. You will struggle to put the two dates in the wrong order, because moving one moves the other: pick a start later than the current end and the end date is pushed out to keep the same span, and pick an end earlier than the start and the start is pulled back the same way. Only a window that was already back-to-front when you opened the dialog can survive that, and then Update Timeline refuses with Start date must be before end date.
and nothing is saved.
Dates must sit between 1 January 1950 and 1 December 2100; outside that you get Enter a date between 01-Jan-1950 and 01-Dec-2100.
On an hourly chart the same message carries the time of day as well — Enter a date between 01-Jan-1950 12:00 AM and 01-Dec-2100 12:00 AM.
— because every date on an hourly chart is a date and a time.
The column widths
The lower half of the dialog, headed Column Width, holds one width per view: Hourly, Daily, Weekly, Monthly, Quarterly, Half Yearly and Yearly. This is your zoom control. Widen the daily column to read the dates comfortably; narrow it to fit more of the project on screen.
Each view remembers its own width, so setting Daily to 4 and Monthly to 12 means both look right when you switch between them. The Hourly box is hidden on a daily chart, since that chart has no hourly view to size.
| Box | Smallest allowed | Largest allowed |
|---|---|---|
| Hourly, Daily | 2 | 100 |
| Weekly | 3 | 100 |
| Monthly, Quarterly, Half Yearly, Yearly | 4 | 100 |
Type something outside the range and you are told Enter a number of 4 or greater.
— with that box’s own minimum in the sentence — and the field resets to it.
05 Show Full Timeline
Gantt Excel → Views and Timeline → Show Full Timeline is the one-click answer to “where did my bars go?”. Instead of sliding a fixed-width window around, it takes the width from your data: it reads the earliest task start and the latest task finish on the sheet, and sets the window to cover them.
Three details are worth knowing:
- It includes the bands you can see. The Estimated dates are always read; the Baseline and Actual dates are folded in as well whenever those bars are being displayed. So “full” means every bar actually on screen, not just the estimated ones. (See Baselines & actuals.)
- It snaps to whole periods of the current view. In Weekly View the window starts on a Monday and ends on a Sunday; in Monthly View it runs from the 1st to the last day of the month; quarters, half-years and years likewise. In Daily View and Hourly View there is no period to snap to, so it takes the exact days.
- Hidden and filtered rows still count. The span is measured from the date columns themselves, so a task you have filtered out of sight still stretches the window.
Worked example — the kitchen refit
Your kitchen refit runs from Mon 6 July (first task starts) to Fri 14 August (last task finishes) — 40 days. In Daily View, Show Full Timeline sets the window to exactly 6 July → 14 August, 40 columns. Switch to Weekly View and click it again and you get Mon 6 July → Sun 16 August, six week-columns: the same project, snapped out to whole weeks so no bar is cut in half at either edge.
Two views have a ceiling
Hourly View and Daily View stop widening past a fixed number of columns, however long the project is. The other five views have no limit.
| View | Widest timeline | In real time |
|---|---|---|
| Hourly View | 480 columns | 20 days |
| Daily View | 720 columns | Just under two years |
| Weekly and coarser | No limit | — |
The hourly ceiling is deliberate: an hourly bar is built from one block per working hour, and past about three weeks the chart stops being readable long before it stops being drawable.
On an empty or unscheduled chart there is nothing to fit to, and you are told so: There are no scheduled tasks to fit the timeline to. Add a task with a start date first.
06 Scrolling: Scroll To, and the timeline arrows
Where Show Full Timeline resizes the window, Scroll To slides it — the window keeps exactly the width it already had. It is the dropdown on the Show Full Timeline button, and it holds three destinations:
Scroll to Start — moves the window to the earliest task start in the project.
Scroll to Today — moves the window to today’s date. The one to reach for at a stand-up.
Scroll to End — moves the window to the latest task finish.
All three align the window to the current view’s period, so Scroll to Today in Monthly View starts the window on the 1st of this month rather than mid-month. Scroll to Start and Scroll to End read the Estimated dates only — unlike Show Full Timeline, they do not stretch to reach a baseline or actual bar that runs further out.
The four arrows on the timeline header
There is a second, finer control that is easy to miss. At each end of the timeline’s top header row sits a small pair of triangular arrows:
- The pair at the left edge moves the window’s start date back or forward by one period.
- The pair at the right edge moves the window’s end date back or forward by one period.
Because the two ends move independently, these arrows do something Scroll To cannot: they stretch and shrink the window. Nudge the right-hand pair forward three times in Monthly View and you have added three months to the view without opening a dialog. One period means one day in Daily View, one week in Weekly View, one month in Monthly View, and so on — and always exactly one calendar day in Hourly View.

07 Show Task in Timeline
You have a hundred tasks and one of them is nowhere near the window you are looking at. Show Task in Timeline brings its bar into view without you hunting for it. There are two ways to run it:
Right-click the task row and choose Show Task in Timeline.
Double-click the task’s WBS number — the outline number in the left-hand column. A double-click there jumps the timeline instead of opening the Task Form, which stays a double-click away in the task name and most other columns.
It is careful about your window, and the distinction matters. If the task’s bar overlaps the dates you are already showing — even by a single day, even if the bar is wider than the whole window — it only scrolls the sheet sideways and leaves your start and end dates exactly as you set them. Only when the bar falls entirely outside the window does it move the window, and even then it keeps the same width and starts one period before the task, so the bar does not end up jammed against the left edge.
A task with no start date has nowhere to jump to, and says so: This task has no start date yet, so there is nothing to show on the timeline. Set a start date first.
08 Hiding and pausing the timeline
Two tickboxes in Views and Timeline turn the timeline off, in two different ways.
“I want the task list on its own.”
Untick Show Timeline and the whole timeline band goes — every Gantt bar, the today line and the dependency arrows with it — leaving just the task table. Useful for reading or printing the data as a plain list.
Tick it again and the timeline is rebuilt from your dates. Nothing is lost — the bars and arrows are drawn, not stored.
“Stop redrawing while I work.”
Untick Refresh Timeline and the timeline stays on screen but stops redrawing itself after every edit. A red panel reading Timeline Refresh – Paused appears over the band so you cannot forget it is off.
Worth doing before pasting or retyping a long stretch of dates; tick it again afterwards and the chart catches up in one rebuild.
09 Row height and column width
The Rows and Columns section sizes the grid itself. It has nothing to do with which dates you are showing — this is the paper, not the picture.
- Row Height — select the task rows you want to change, then Gantt Excel → Rows and Columns → Row Height. A small dialog asks for a Height: in points. Taller rows give the bars more room and make a printed chart easier to read.
- Column Width — click in one column of the task list, then Column Width, and give it a Width: in characters. Handy when a long task name or a resource list is being clipped.
- Auto Col Width — sizes the selected columns to fit their longest entry, so nothing is clipped and nothing is wider than it needs to be.
Two things Column Width will not do, and both say so rather than failing quietly. Select more than one column and you get Select only one column to set the column width
. Select a column inside the timeline and you get Column width for the timeline cannot be changed
— timeline columns are sized per view in Setup Timeline (section 04), because every column in a view has to stay the same width for the bars to line up. A value that is not a number, or one outside Excel’s own limits, is refused with Entry must be a valid number.

10 Common questions
My bars have vanished. Where have they gone?
Why is Hourly View missing from my ribbon?
I switched my hourly chart to Daily View and the bars look completely different. Is that a bug?
Show Full Timeline warned me about the number of columns. Should I worry?
Can I make the timeline columns wider just for this chart?
Column width for the timeline cannot be changed, because every column in a view has to be the same width or the bars stop lining up with the dates.
What is the difference between Show Full Timeline and Scroll to Start?
Related: Planning by the hour · Grouping & task filters · Exporting & printing · Settings