
The Task Form
The Task Form holds everything about a task in one window: its name, dates, progress, people, costs and colours.
The form has two tabs. Task Details holds the task itself: name, priority, status, notes, three bands of dates, progress, resources, costs and bar colours. Dependencies is where you link the task to a predecessor (the task this one waits on), so the schedule flows automatically. When the task is a milestone, the first tab is titled Milestone Details instead.
01 Opening the Task Form
There are five ways in, and they all land on the same form:
Double-click the task’s name cell in the sheet. The form opens with that task’s details already filled in. This is the everyday way to edit an existing task.
Add a task from the ribbon. Gantt Excel → Tasks → Add Task opens a blank form so you can create the task and set everything in one go.
Edit from the ribbon. Select a task row, then Gantt Excel → Tasks → Edit opens the same form on that task.
Right-click a task row and choose Edit Task from the Gantt Excel block at the top of the menu.
Select the task and press Alt Enter. This is the keyboard route to the same form.
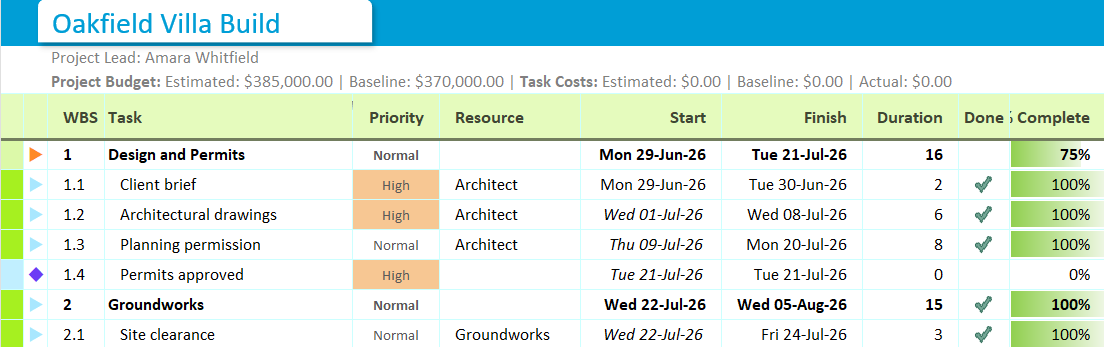
A double-click is routed by the column you land on, not just the row. The name cell and most other columns open the Task Form. The rest each open whatever matches the column: a double-click in the timeline sets the task’s Estimated Start Date to the date you clicked; Resources opens the resource picker; Priority opens the priority picker; a date column opens a date picker; a colour column opens a colour picker; WBS scrolls the timeline to that task’s bar; and Done toggles the task’s Done tick. When in doubt, double-click the name.

02 A tour of the form
Here’s the whole Task Details tab at a glance. Hover or tap a pin to see what each area does. The numbered key below lists them all.
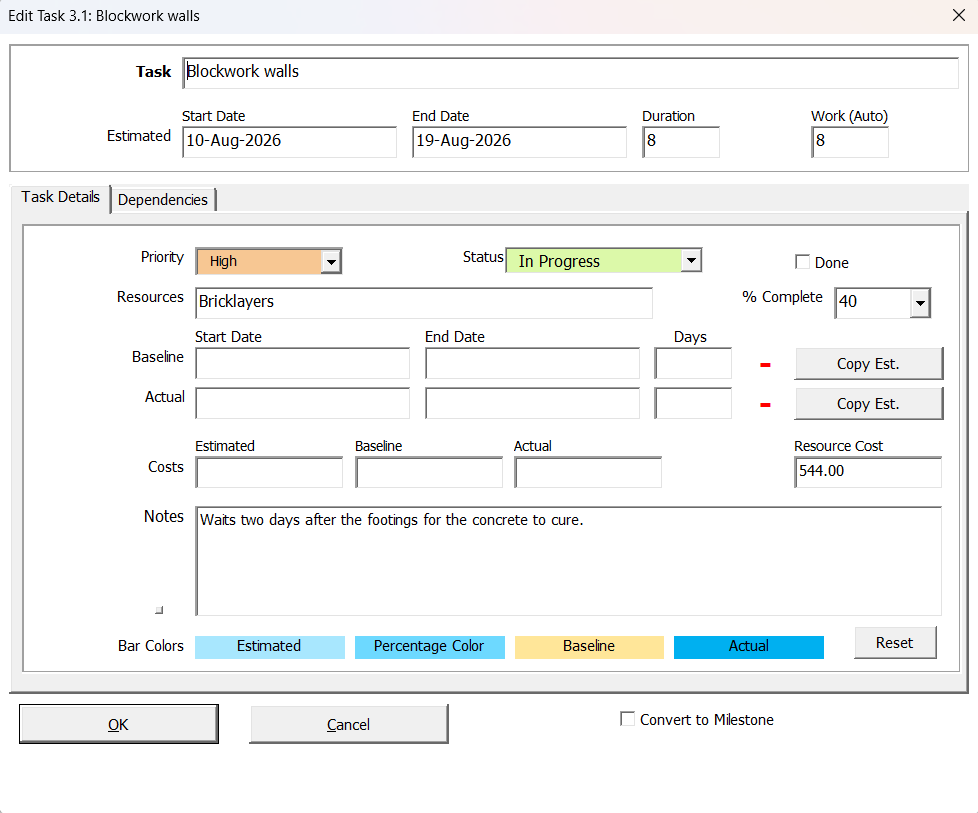
- Task name. The title of the task, as it shows on the sheet and the chart.
- Tabs. Task Details here; Dependencies on the second tab.
- Priority, Status & Notes. Priority is yours to set: High, Normal or Low. Status is read-only and follows % Complete. Notes is a free-text box for anything the task name can’t carry.
- Estimated band. Your live plan: start date, end date and duration. The cost figures live in the Costs group, not here.
- Baseline & Actual bands. The saved snapshot and what really happened, each with a Copy Est. button.
- % Complete & Done. Progress, its shading colour, and the Done tick, which also fills in the Actual dates.
- Work, Resources & costs. Planned work, assignments, and the auto resource cost.
- Bar Colors. One swatch per band, plus Reset.
- Convert to Milestone. Turns the task into a zero-duration diamond marker.
03 The basics: name, priority, status & notes
The Task name is the box at the top. It appears in the task list and on the Gantt chart, so keep it short and action-shaped (“Install fixtures”, not “Fixtures”).
Alongside it sit two dropdowns and a free-text box:
- Priority — High, Normal or Low. A label for how important the task is; it doesn’t change the schedule. This one is yours to set, on every task including summary tasks.
- Status — Not Started, In Progress or Completed. This one you don’t set. It is written for you from % Complete and updates the moment you change that field. Task Status is automatically set based on Task Percentage Completed. The rule behind it is simple: 0% is Not Started, anything from 1% to 99% is In Progress, and 100% is Completed.
- Notes — a free-text box for anything the task name can’t carry: a supplier reference, an access restriction, the reason a date moved. It has its own column on the sheet, so you can read it without opening the form.
04 Dates & duration
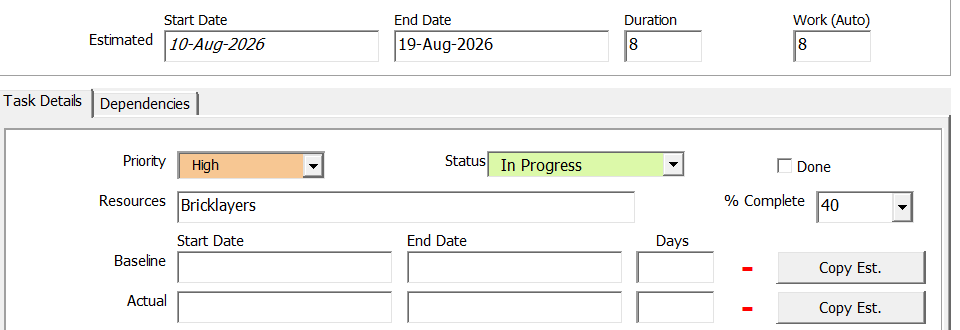
Each date band has the same three fields: Start Date, End Date and Duration. In the Estimated band they interlock, and the rule is Start, plus one of the other two:
- Enter Start Date + Duration → the End Date is worked out.
- Enter Start Date + End Date → the Duration is worked out.
- Change the Duration of a scheduled task → the End Date moves to match.
The Estimated band can’t do without a Start Date, because there is nothing to count forwards or backwards from until a start exists.
Baseline and Actual work differently, because they are not schedules. A dependency can move the Estimated dates at any moment, so in that band the length is what Gantt Excel holds on to. Baseline and Actual are records of what was agreed and what happened, and nothing moves them on your behalf. In those two bands Gantt Excel stores the two dates, and the Duration is a readout of the working days between them:
- Change the Start Date → the End Date stays exactly where it is, and the Duration is re-counted.
- Change the End Date → the Start Date stays put, and the Duration is re-counted.
- Type a Duration → the End Date moves to the Start Date plus that many working days. The Start never moves.
- Clear the Duration → the End Date clears with it, the same as clearing the end.
Neither band insists on a start date first. Record an End Date or a duration on a band whose Start is still empty, and Gantt Excel fills the Start in from the Estimated Start Date, never later than the end you just recorded. The message strip at the foot of the form tells you: The Baseline Start Date was blank, so it has been set to {0}.
The Actual band gives the same message for itself. This helps when you are catching up on a stale plan and know when things finished but not exactly when they started.
Every calculation follows the assigned resource’s working calendar, so weekends and holidays are skipped. A 5-day task that starts on a Thursday finishes the following Wednesday, not on Monday.
The Duration label reads Days on a day-based chart, or Hours on an hourly one. The maths is the same at a finer grain.

05 Estimated, Baseline & Actual
The same three date fields appear in three bands, and each band answers a different question about the task.
“When do we currently think this will happen?”
Estimated is the band you work in every day. Its Start Date, End Date and Duration drive the main bar on the Gantt chart, the dependency engine and the critical path. When plans change, change the Estimated dates and the schedule reflows from them.
Fill it in first, for every task. The other two bands only make sense once an estimate exists.
“What did we originally promise?”
The baseline is a frozen copy of the plan, taken at a moment you choose, usually the day the plan is approved. Unlike Estimated, it doesn’t move when the schedule shifts, so it is the yardstick you measure slippage against.
The quickest way to set it is the Copy Est. button. One click copies the Estimated Start Date, End Date and Duration into the Baseline band. You can also type the dates by hand, in either order, and clear them if you want to re-baseline later.
“What really happened?”
Fill in Actual dates as the work happens: the start when the task genuinely begins, and the end when it genuinely finishes. This band never moves the schedule on its own. At most it offers to, and you decide.
An Actual End Date is a claim that the task finished, so recording one takes it to 100% and ticks Done. Clear the end again, or clear the Actual Start (which clears the band), and the percentage you had before comes back rather than resetting to zero. An Actual Start Date on its own does not change the percentage.
Copy Est. saves you the typing when reality matched the plan. It copies both dates, and because that says the task finished exactly as planned, it marks the task 100% and Done too.
Worked example: spotting slippage
You plan “Fit kitchen units” for Mon 6 July → Fri 10 July (5 working days) and click Copy Est. in the Baseline band the day the plan is approved. Mid-project, a delivery slips and you push the Estimated dates out. The units are finally finished on Tue 14 July, which you record as the Actual end.
| Band | Start | End | What it tells you |
|---|---|---|---|
| Baseline | Mon 6 July | Fri 10 July | The original promise |
| Estimated | Mon 6 July | Tue 14 July | The revised plan after the delay |
| Actual | Mon 6 July | Tue 14 July | What really happened |
Baseline against Actual shows the task ran 2 working days late (the weekend in between doesn’t count). Because the baseline never moved, that slippage stays visible.
Costs for each band
Each band also has a cost figure. The three cost boxes are not in the date bands; they sit together in the Costs group of the form (see section 07).
- Estimated — what you expect the task to cost.
- Baseline — the budget you signed up to when you set the baseline.
- Actual — what the task really cost.
Side by side, the three figures show budget slippage the same way the three sets of dates show schedule slippage.
06 Progress: % Complete, Done & Work
% Complete is how far along the task is, shown as shading on the Gantt bar. The number can be typed in by hand or calculated automatically from elapsed time, and parent tasks roll it up from their children. The full story (Manual against Automatic, Simple against Weighted) is in the % Complete guide. Next to the field, the Percentage Color picker sets the colour of that progress shading on the bar.
Done is the shortcut, and it does two things. Tick it and the task goes to 100% complete, and the Actual dates are filled in on the form straight away, before you click OK, so you can check and correct them.
What it fills in:
- Actual Start Date — the Estimated Start Date, if the box is empty. A start you already recorded is left alone.
- Actual End Date — the Estimated End Date or today, whichever is earlier, and never earlier than the Actual Start.
Each adjustment has a reason. Today’s date alone would record thirty tasks ticked off in one catch-up session as all finishing this morning. The planned end alone would record a task finished early as finishing in the future. And without the last check, a task planned for late September and ticked today would end weeks before its filled-in start.
Untick it and the Actual End Date is withdrawn while the Actual Start Date stays, because un-ticking says the task didn’t finish, not that work never began. The percentage goes back to whatever it showed before the tick, not to zero. Where there is nothing to go back to, because the task was completed in an earlier session, the form says so: The previous percentage of {0} is not known – it was completed in an earlier session – so it has been set to 0%.
Typing 100 into % Complete does exactly what the tick does, and typing anything lower clears the Actual End again. Status follows every one of these moves.
When % Complete is set to calculate automatically, the tick can’t be set by hand. Clicking it shows Percentage Complete is calculated automatically, so the Done tick cannot be set by hand. Enter an Actual End Date to record the task as finished, or turn off automatic calculation in the Settings window.
and puts the tick back where the stored percentage says it belongs. Clicking into % Complete itself shows the shorter version, Percentage Complete calculation is set to Automatic. You can turn this off in the Settings window.
As with Status, a field that is calculated for you can’t also be typed over.
Work is how much person-time the task needs. Leave it alone and Gantt Excel keeps it in step with the task for you:
So a 4-day task with 2 people assigned works out at 8 days of work. Type your own figure whenever the real person-time differs, say two people each working half-days. The label tells you which is in force: it reads Work (Auto) while Gantt Excel is calculating it, and Work (Manual) once you have pinned a figure of your own.
Changed your mind about a pinned figure? Clear the Work box and it goes straight back to Auto. The calculated value reappears in the field immediately and the label flips back to Work (Auto), so you can see what you are reverting to before you save. On a summary task the label is simply Work with nothing in brackets, because a parent’s Work is rolled up from its children and can never be pinned.
07 Resources & costs
The Resources field is who’s doing the task. Assigning a resource does two useful things: the task follows that resource’s working calendar, and costs start calculating themselves.
- Resource Cost is worked out for you. It adds up the rates of everyone assigned, then multiplies by the time each of them spends on the task (Work divided by the number of resources). While Work is on Auto that is simply the task’s duration, so pinning a Work figure of your own is the only thing that changes the answer. Set rates once on the Resources sheet and every assigned task prices itself.
- Costs is the heading over the money boxes, not a box of its own. Underneath it sit three figures you type, one for each band.
- Those three are Estimated, Baseline and Actual, so budget slippage is tracked exactly the way date slippage is.
Two things about Resource Cost catch people out. A task with nobody assigned costs nothing: there is no rate to apply, so the box stays blank. The same is true of Organization. It is the project’s default-calendar anchor, not a person you can bill, so it carries no rate and prices nothing. If a task should have a cost and doesn’t, check that a real resource is assigned.
If you can’t find the money boxes at all, costs are switched off. With costs turned off in Settings, the whole Costs group (the heading, all three band figures and Resource Cost) disappears from the form.
The Work, costs & budget guide covers how Work and Resource Cost are calculated, what the project budget line adds up, and the two Settings that switch costs on.
08 Bar colours
Each band draws its own bar on the chart, and each has its own swatch under Bar Colors in the form: Estimated, Baseline and Actual. Click a swatch to pick a new colour for that task’s bar, which is handy for making one workstream or one critical task stand out.
Changed your mind? The Reset button puts them back to the project’s default colours in one click.
09 Turning a task into a milestone
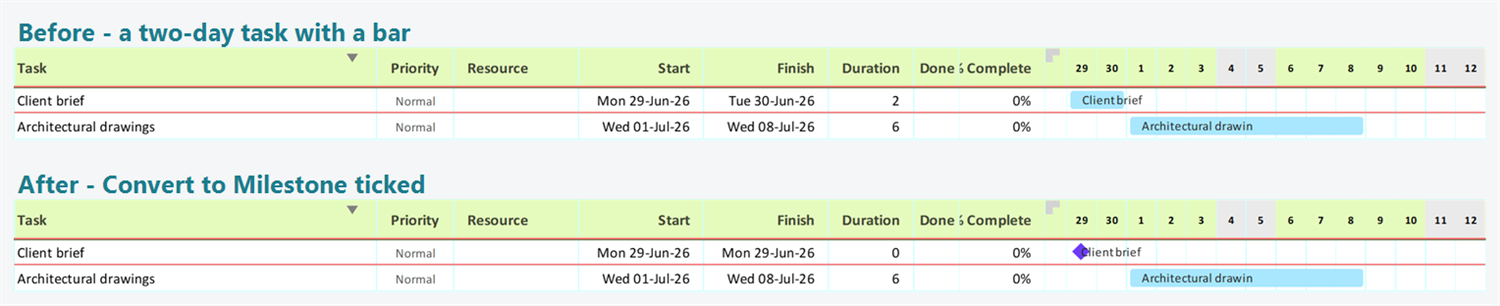
Tick Convert to Milestone and Gantt Excel asks you to confirm: Convert this task to a milestone?
Say yes and the task’s duration is set to 0, its end date becomes the same as its start date, and on the chart it renders as a diamond marker instead of a bar. Milestones suit moments rather than work: “contract signed”, “go-live”, “inspection passed”.
From then on the End Date and Duration fields are locked in every band, because a milestone’s end always mirrors its start. Once converted, the form’s first tab is titled Milestone Details.
The tickbox isn’t always there. It is hidden on a summary task, and on any task whose start date is driven by a dependency, because a conversion would rewrite dates the link controls. To put a milestone at that point in the plan, add one directly with Gantt Excel → Tasks → Add Milestone. The Milestones guide covers that route.
10 Parent tasks are different
Open the form on a parent (summary) task and much of it is read-only. A parent’s dates, duration, costs and Work are all calculated from the child tasks underneath it, so there’s nothing for you to type. Edit the children and the parent follows. % Complete and the Done tick go the same way, and so does Status, which is derived from the rolled-up percentage exactly as it is on any other task.
Priority is the exception. A summary task carries its own priority and the form does save it, so that dropdown stays live while everything around it is locked.
A locked field doesn’t look locked. Gantt Excel leaves these boxes white rather than greying them. You find out by clicking into one: the cursor won’t take, and where there’s a reason to give, the message strip at the bottom of the form gives it.
11 The Dependencies tab
The second tab links this task to others so the schedule keeps itself in order. You pick a predecessor task, choose a link Type, and set a Lag if you want a delay or an overlap. A positive lag pushes the successor later; a negative one overlaps the two tasks.
The Type dropdown spells the four standard kinds out in full (Finish to Start, Start to Start, Finish to Finish and Start to Finish), so you never have to remember which way round SF goes. The short codes turn up elsewhere in the product and in the Dependencies guide; the form doesn’t use them.
The Dependencies guide covers the four link types, lags and how links reschedule your dates in full.
12 Common questions
Why won’t my date fields take anything I type?
What’s the difference between Baseline and Actual?
I converted to a milestone by accident. How do I undo it?
Why did my end date move when I changed the duration?
Do I have to fill in the Baseline?
Where do the Days and Hours labels on Duration come from?
Related: Linking tasks with dependencies · Understanding % Complete · The Critical Path & float