
The Critical Path & float
Every project has one chain of tasks that decides its finish date. If any task on that chain slips, the whole project finishes later. Gantt Excel finds that chain for you — automatically, every time the schedule changes.
Tasks that are not on the critical path have some breathing room — they can slip a little, or start a little later, without pushing the project’s end date out. That breathing room is called float, and it is also known as slack. Gantt Excel works both out for you from your durations, your dependencies and each resource’s working calendar, and writes the answers into five columns on the sheet.
01 What the critical path is
The critical path is the set of tasks you cannot afford to let slip. Everything else has float, and the float columns tell you exactly how much room each of those tasks has.
You never enter any of it by hand. The calculation runs after the scheduler has settled every date, so it always reflects the plan as it stands right now — change a duration, add a dependency or move a start date and the five columns are brought up to date on the next redraw.
02 The five Critical Path columns
Gantt Excel adds five read-only columns to your chart, just before the Custom 1 column. They are calculated results — look at them, sort them, filter on them, but don’t type into them.
| Column | What it tells you |
|---|---|
| Late Start | The latest the task could start without delaying the project. |
| Late Finish | The latest the task could finish without delaying the project. |
| Total Float | How much the task can slip in total before it delays the project finish. 0 means it’s critical. |
| Free Slack | How much the task can slip without moving the earliest task that depends on it. A task with nothing depending on it gets its room to the project finish instead. It is normally equal to or smaller than Total Float. |
| Critical | Yes if the task is on the critical path, No if it has room to spare. |
A critical task is one whose Total Float is 0 — there is simply no room to move. The rule behind the Critical column is exactly that and nothing else:
Zero float does not mean the dates match. Total Float counts working time on the task’s own resource calendar, so a task finishing on a Monday can have a Late Finish of Wednesday and still read 0 — if that resource works Mondays only, there is no working day of theirs in between to spend. It is the float number that decides Critical, never the look of the two dates. Section 07 works that case through.
Total Float is never shown as a negative number — the smallest it goes is zero. And Late Start is worked out by stepping back from Late Finish by the task’s own duration, on that task’s own resource calendar, which is why the two always agree with each other.
03 Switching the red highlight on
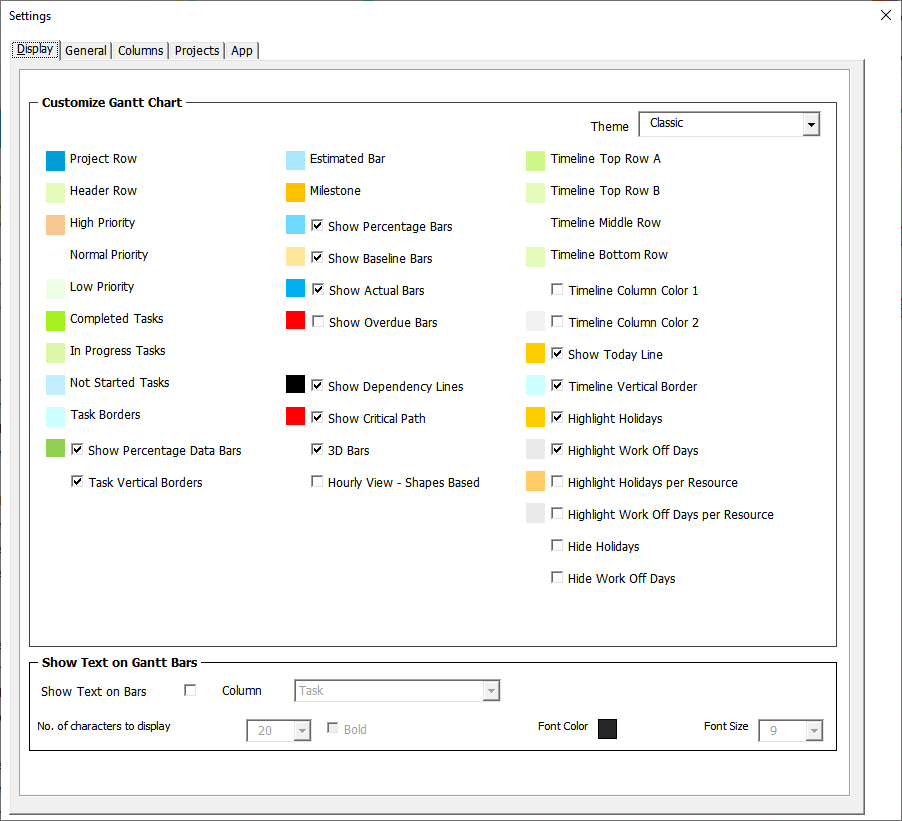
The five columns are always calculated, whether or not anything is red on the chart. The red highlight is a separate, optional thing, and it is controlled by the Show Critical Path tickbox in the Settings dialog — Gantt Excel → Settings → Settings on the ribbon. There is no critical-path button on the ribbon itself.
- Ticked → the critical path is drawn in red on the chart.
- Unticked → the chart looks normal; the five columns still show their values.
That split is deliberate. The columns are data, and stale data is worse than no data — so they are kept current in the background even when you have the highlight switched off and there is nothing on screen to tell you they are being maintained.
The critical-path colour defaults to red and can be changed per chart from the colour swatch beside the tickbox. The tickbox has to be on first: click the swatch with Show Critical Path unticked and Gantt Excel says Enable Show Critical Path first to change its color.
04 Reading the red highlight
Two things turn red, and they answer to slightly different rules.
- Task bars get a red outline when that row’s Critical column reads Yes. Only the outline changes — the bar keeps its own fill colour.
- Dependency arrows turn red only when the tasks at both ends of the link are critical. An arrow from a critical task into one with float stays its normal colour, because that link is not part of the chain.
| Your chart | Task bars | Dependency arrows |
|---|---|---|
| Day-based chart (Daily / Weekly / Monthly) | 🔴 red outline on critical bars | 🔴 red along the critical chain |
| Hourly chart, shown in a day-based view | 🔴 red outline on critical bars | 🔴 red along the critical chain |
| Hourly chart, at the hourly view | 🔴 red outline around the coloured hour cells | 🔴 red along the critical chain |
| Hourly chart, at the hourly view, with Hourly View – Shapes Based ticked | no outline on task bars — critical milestones keep their red diamond outline | 🔴 red along the critical chain |
The last row is the one exception worth knowing. An hourly chart normally paints its bars by colouring the hour cells themselves, and a critical task gets a red border drawn round that block of cells. Tick Hourly View – Shapes Based in Settings and the bars become drawn objects instead, and that alternative renderer does not outline them. Milestones are unaffected either way — they are drawn as diamonds by the day-based renderer whichever hourly mode you are in, so a critical milestone is still outlined in red. For ordinary tasks the red arrows are then your only visual cue. In every case the five columns are fully correct; the red is a visual aid sitting on top of them.

05 Day-based charts: everything is in days
The unit follows the kind of chart you created, not the view you happen to be looking at. On a day-based chart — any chart that is not an hourly one — durations are in working days, so the critical-path numbers are in working days too, whether you are viewing it daily, weekly or monthly:
- Total Float and Free Slack are a number of working days.
- Late Start and Late Finish are shown as dates.
Working days respect the resource’s calendar — weekends and holidays are skipped, exactly like the bars on the chart.
Worked example — the villa’s first fix
Take the First Fix phase of the Oakfield Villa build. A Monday–Friday week, no holidays in the way. Three trades start the moment the house is watertight, and the plastering waits on the two that hide their work behind the walls:
| Task | Starts | Critical | Total Float |
|---|---|---|---|
| Electrical first fix | Thu 3 Sep | Yes | 0 days |
| Plumbing first fix | Thu 3 Sep | No | 1 day |
| Plastering | Thu 10 Sep | Yes | 0 days |
Both trades are on site from Thursday 3 September, but the electrician needs five days and the plumber only four. The plasterer cannot start until both are out, so plastering begins on Thursday 10 September either way — which hands the plumber one working day of float. Their Late Start reads Friday 4 September: they could turn up a day late and hold nothing up. The electrician has no such slack, so a single day lost on the wiring moves the handover.
Notice what float is not. Windows and doors starts the same morning and carries 18 days of float — not because it is unimportant, but because nothing waits on it at all, so its slack runs all the way to the end of the project.
06 Hourly charts: everything is in hours
On an hourly chart, durations are measured in working hours rather than days — so the critical-path numbers switch to hours automatically. That is a property of the chart, so switching it into a daily view to see a wider span does not change it: the figures stay in hours.
- Total Float and Free Slack are a number of working hours.
- Late Start and Late Finish carry a date and a time of day. They pick up their format from the chart’s own start-date column, so they show exactly the same way your other dates do.
“Working hours” respect each resource’s working day. If a resource works 9:00–17:00, a task finishing at 17:00 and the next one starting at 9:00 the following morning are treated as back to back — the overnight gap is not counted as float, because none of it is working time. That is what lets hour-based float be exact instead of rounding everything to whole days.
Worked example — installation day
The same refit, planned by the hour. One fitter working 9:00–17:00 (8 working hours a day), Monday–Friday:
| Task | Start | Finish | Critical | Total Float |
|---|---|---|---|---|
| Deliver and unpack | Mon 09:00 | Mon 17:00 | Yes | 0h |
| Fit units | Tue 09:00 | Tue 13:00 | Yes | 0h |
| Fit splashback | Tue 09:00 | Tue 11:00 | No | 2h |
| Connect appliances | Tue 13:00 | Tue 17:00 | Yes | 0h |
The critical path is Deliver and unpack → Fit units → Connect appliances. Fit splashback finishes at 11:00, but connecting the appliances can’t start until 13:00 — it is waiting on the longer Fit units — so the splashback carries 2 working hours of float. Its Late Start reads Tue 11:00: it could begin two working hours later and still hold nothing up.
Notice the numbers are the same idea as the day example, just measured in hours instead of days. That is the whole difference between the two.
07 When linked tasks use different working calendars
Each resource has their own working week, and float is always counted in the working time of the resource doing the task. When two linked tasks are done by resources who work different days, that has a consequence people rarely expect: a gap that looks like clear breathing room on the calendar can be worth no float at all.
A worked example
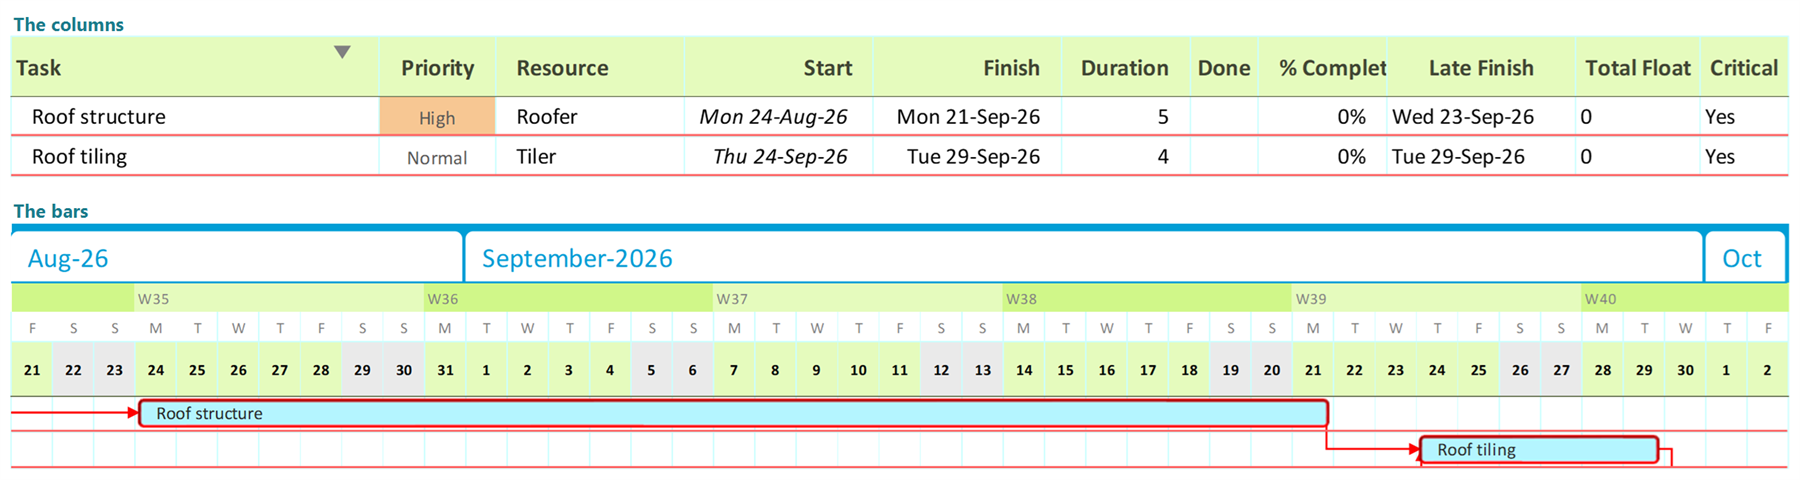
Suppose the crane the roofers need is only on site on Mondays, so the Roofer works Mondays only, while everyone else works Monday to Friday. Roof structure finishes on a Monday. Roof tiling depends on it — but it is also waiting on other work that runs longer, and that is what sets its start, so it begins on the Thursday.
Two clear days sit between them, so it is tempting to read that as slack. Gantt Excel works out that the roof structure could indeed finish as late as the Wednesday without moving the tiling — that is its Late Finish. It then measures the distance from the Monday to that Wednesday on the roofer’s calendar, and the roofer works neither the Tuesday nor the Wednesday:
| Task | Finishes | Late Finish | Total Float | Critical |
|---|---|---|---|---|
| Roof structure | Monday | Wednesday | 0 days | Yes |
So the roof structure is on the critical path. That is the right answer, and you can check it yourself: the roofer’s next working day is the following Monday, which is after the tiling was due to start — so letting the structure slip by one of the roofer’s own days pushes the tiling, and everything after it, out.
Float is always in the task’s own working time
This is the part that most often surprises people. Float is measured in the working time of the resource doing that task — not in calendar time, and not in anyone else’s hours. Suppose the plan above were looser and both of those tasks did have room. Both could show 3 and mean very different things:
| Task | Resource works | Total Float | Roughly how much calendar time |
|---|---|---|---|
| Roof structure | Mondays only | 3 days | About three weeks |
| Roof tiling | Monday–Friday | 3 days | About three days |
Both are correct. “Three days of float” means “this task’s resource could put in three more of their working days before anything downstream moves”. If you want to know how much of the calendar that buys, look at the Late Finish date — that is the answer as a real date.
08 Summary tasks & milestones
A summary (parent) row doesn’t get its own calculation — every value on it is taken straight from the tasks underneath:
- Critical reads Yes if any task inside it is critical.
- Total Float and Free Slack show the smallest value among its tasks — the tightest one in the group.
- Late Start is the earliest Late Start inside it and Late Finish the latest Late Finish, so the row spans the full late window of everything it contains.
One consequence is worth knowing. On a summary row, Total Float is a summary statistic — the tightest task in the group — so it won’t always line up arithmetically with that same row’s Late Finish. On the individual task rows underneath, the two always agree exactly.
Linking a task to a summary row
You can point a dependency at a summary row rather than at an individual task, and it means what you would expect: “start when everything in that group is finished.” A summary row finishes when the last task inside it finishes, so that is the date your successor waits for.
It works the same way in reverse, which is the part worth spelling out. If the successor’s deadline pushes back onto the summary row, that deadline belongs to every task inside the group — because the group can only be finished once all of them are. So the whole chain leading into that group is measured against it, and any task inside with no room to spare shows up as critical, exactly as it would if you had linked to it directly.
09 Quick reference
| Day-based chart | Hourly chart | |
|---|---|---|
| Total Float / Free Slack unit | Working days | Working hours |
| Whose working time is it measured in? | The task’s own resource — so a wide calendar gap can still count as zero; see section 07 | |
| Late Start / Late Finish | Date | Date and time |
| Critical bars outlined in red | ✅ | ✅ except with Hourly View – Shapes Based on |
| Critical arrows turn red | ✅ both ends must be critical | ✅ both ends must be critical |
| Columns calculated with the highlight off | ✅ always | ✅ always |
| You edit these columns | Never — they’re calculated | Never — they’re calculated |
10 Common questions
Two tasks both say Yes and seem to run in parallel — is that a mistake?
A task shows Critical = Yes but I expected it to have float.
A task shows float but I expected it to be critical.
I used a negative lag (a lead) so a task can start before its predecessor finishes.
Nothing turns red even though tasks show Critical = Yes.
The columns look empty on an older chart.
Related: Linking tasks with dependencies · Planning by the hour · Resources, calendars & working days · Settings