Project Management Excel Template
The file you run the project from once the plan is written. Record progress each week and it tells you what’s late, who’s overloaded, where the money has gone and how far you’ve slipped from what you promised.
Runs in Microsoft Excel. Nothing to install, no account.

01 Managing a project in Excel is a weekly routine
Writing the plan takes an afternoon. Managing the project is the other ninety-nine per cent, and most of it is the same half hour repeated every week. Update what happened. Look at what’s late. Check that nobody has three things due on the same day. Glance at the money. Tell the people who need to know.
A project management template earns its place if it makes that half hour shorter. The one on this page does it by keeping everything on the same rows as the plan. Progress, status, people, costs and the original promise all sit beside the task they belong to, so there’s nothing to copy between files and nothing to reconcile at the end of the month.
If you haven’t built the plan yet, start with the project plan template. It covers tasks, phases, links, milestones and the baseline. This page picks up from the day the plan is agreed, and it follows the same example: the Oakfield Villa build that runs through the Gantt Excel documentation.
The Monday half hour, in order.
- Tick off what finished last week and update the percentage on anything under way.
- Hide the finished work and read what’s left.
- Look at the overdue rows and the critical path, and decide what to do about them.
- Check the people on this week’s tasks are actually available.
- Compare cost and dates against the baseline.
- Refresh the dashboard, export a report and send it.
The sections below take those in the same order.
02 Record progress the way it really happened
Every task carries a % Complete. There are two ways to fill it, and the choice matters more than it looks.
Manual
You type the number, or the person doing the work tells you. Nothing overwrites it. This is the honest setting for a real project, because time passing isn’t the same as work getting done.
Automatic
The percentage is worked out from how much of the task’s scheduled working time has gone by. Useful for a plan you’re demonstrating, or for work that really does progress at a steady rate.
New charts start on Manual. You switch between them on the General tab of Settings.
When a task is finished, tick its Done box rather than typing 100. It does the same to the percentage, and it also fills in the task’s actual start and finish dates for you, which is what makes the plan-against-actual comparison in section 06 possible. Tick off fifty tasks that way and you have fifty sets of real dates without typing one.
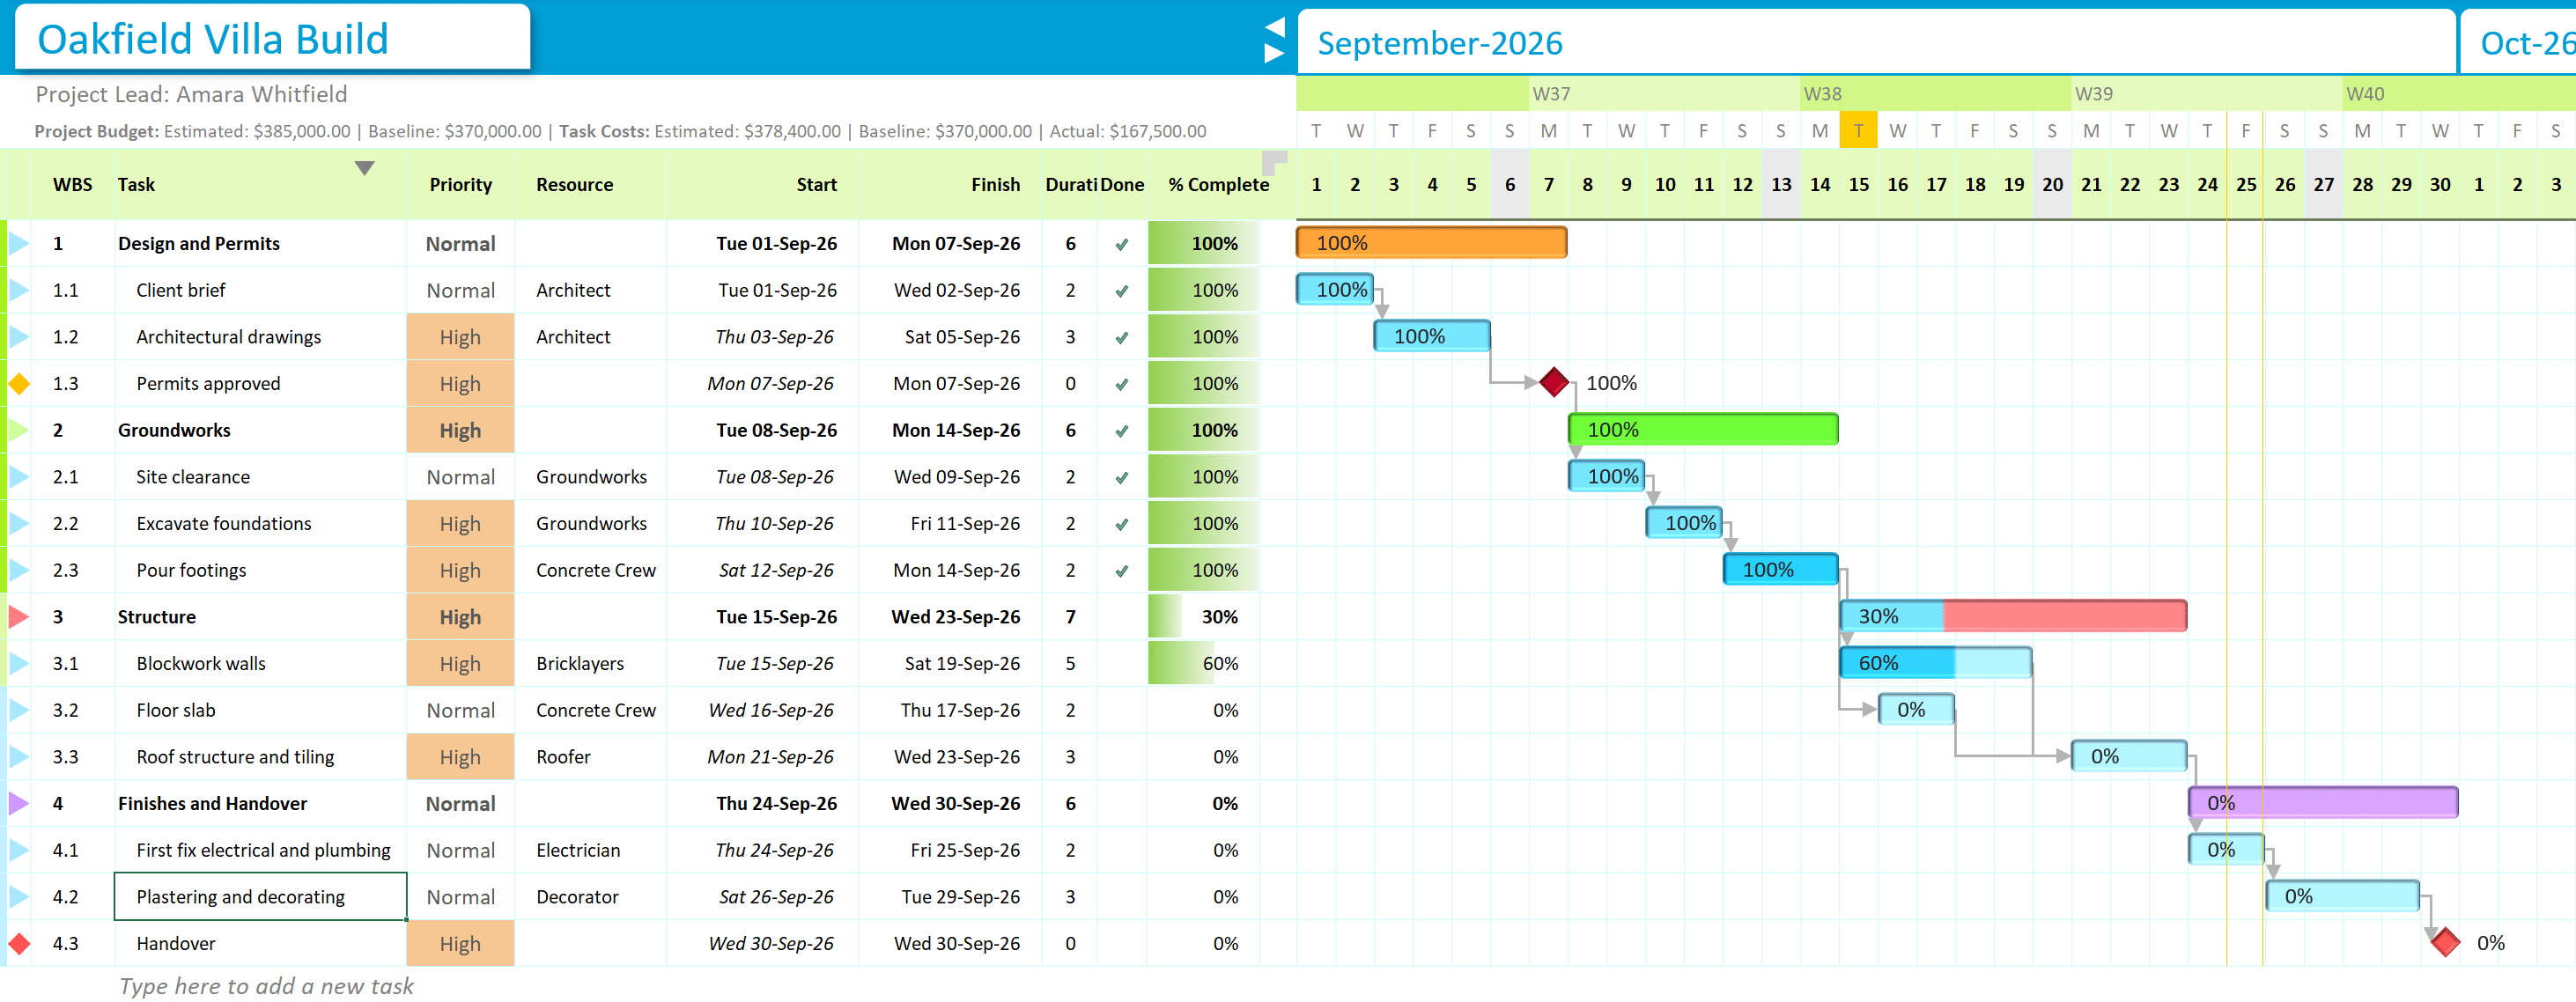
The villa halfway through. Two phases ticked off, Structure at 30% and everything after it still at 0%. Each bar carries its own percentage.
Summary rows add up their tasks by size. A two-day task finishing doesn’t make a thirty-day phase look half done. Understanding % Complete shows the arithmetic for both settings.
03 Let the status look after itself
You never set a task’s status. It follows the percentage: 0% is Not Started, anything from 1% to 99% is In Progress, 100% is Completed. Type 35 into % Complete and the task becomes In Progress in the same keystroke. That’s one less column to keep in step by hand, and one less way for the plan to disagree with itself.
Overdue works differently on the sheet. It isn’t a status. It’s a colour. Turn on Show Overdue Bars in Settings and any bar past its end date that isn’t finished is repainted in the overdue colour, so a late task is visible from across the room when you scroll a hundred-row plan.
Priority is the one you do choose: High, Normal or Low. Nothing in the scheduling reads it, so it never moves a date. It tints the cell, it’s counted on the dashboard, and it’s a quick way to say “this one first” to the team. Priority, status and task colours has the full rules.
04 Hide the finished work and look at what’s left
By the middle of a project half the rows are done, and they’re in the way. The Filters section of the ribbon has three boxes: Show Completed, Show In Progress and Show Not Started. Untick Show Completed and every finished task drops out of view. Nothing is deleted and no dates change. Tick it again and they’re back.

Show Completed unticked. The row numbers skip where finished tasks are hidden.
A phase stays on screen while any of its tasks are still showing, and disappears once all of them are hidden, so you never get an empty heading. The filter is saved with the chart, so if a plan looks like it’s lost tasks, check the Filters boxes before anything else.
Grouping is the other tool, and it hides rows for a different reason. It folds a phase down to its summary row so you can read the plan at phase level. The two can’t be on at once. Grouping and task filters explains why.
05 Know which late tasks will cost you the finish date
Not every late task matters. Some have room to slip. Others sit on a chain where one lost day moves the handover. The critical path is that chain, and turning it on shows you which is which.
Tick Show Critical Path on the Display tab of Settings. Critical bars and the arrows between them turn red, and five columns appear beside the grid: Late Start, Late Finish, Total Float, Free Slack and Critical. A task is critical when its total float is zero. That’s the whole rule.

Critical tasks in red, with the five calculated columns beside them.
Here it is on the villa’s first fix. Both trades start the day after the house is watertight, and the plasterer has to wait for both of them.
| Task | Starts | Days | Critical | Total float |
|---|---|---|---|---|
| Electrical first fix | Thu 3 Sep | 5 | Yes | 0 days |
| Plumbing first fix | Thu 3 Sep | 4 | No | 1 day |
| Plastering | Thu 10 Sep | 6 | Yes | 0 days |
A Monday to Friday week. The plumber could start a day late and hold nothing up. The electrician can’t.
So when you’re reading the overdue rows on a Monday, read the Critical column next to them. A late plumbing task with a day of float is a conversation. A late electrical task with none is a problem for the whole job. The critical path and float covers the rest.
06 Measure slippage against what you promised
Every task holds three sets of dates. The Baseline is what you promised when the plan was agreed. The Estimated dates are what you now expect. The Actual dates are what happened. The baseline never moves once it’s set, and that’s the whole point of it.
Take the villa’s architectural drawings. They were baselined the day the architect’s fee was agreed. Then the survey came back late and two rounds of revisions doubled the drawing time.
| Band | Start | End | Duration | Cost |
|---|---|---|---|---|
| Baseline | Mon 29 June | Wed 1 July | 3 days | £2,400 |
| Estimated | Wed 1 July | Wed 8 July | 6 days | £2,950 |
| Actual | Wed 1 July | Wed 8 July | 6 days | £3,010 |
Working days, Monday to Friday.
Read it in four numbers. It started 2 working days late. It finished 5 working days late. It took twice as long as planned. And it came in £610 over, which alongside the five days of slippage works out at roughly £122 a day of delay.
The late start was somebody else’s problem arriving on your doorstep. The doubled duration is the one to act on, because it says a task was harder than anyone thought, and there are probably similar tasks still to come.
Re-baseline only when the scope really changes. The client adds a room, and holding the team to the old promise is just noise. Then re-baseline. Doing it to make a slipping project look tidy destroys the only record of what you originally committed to, and there’s one baseline per task with no undo.
Show Baseline Bars and Show Actual Bars in Settings draw all three as bars on each row, which is often quicker to read than the columns. Baselines and actuals covers setting, re-setting and reading them.
07 Check the people before you check the dates
Half of all late tasks are late because the person on them was somewhere else. Every resource in the template has a calendar: the weekdays they work, their holidays and, on an hourly chart, their shift and break times. Every duration is counted in that person’s working time.
So keeping calendars current is project management, not admin. When someone books a week off, add it to their holidays in the Resources window. Every task assigned to them re-flows around the week when you close the window, and anything linked after those tasks moves too. You find out on the day the holiday is booked, not the day the work was due.
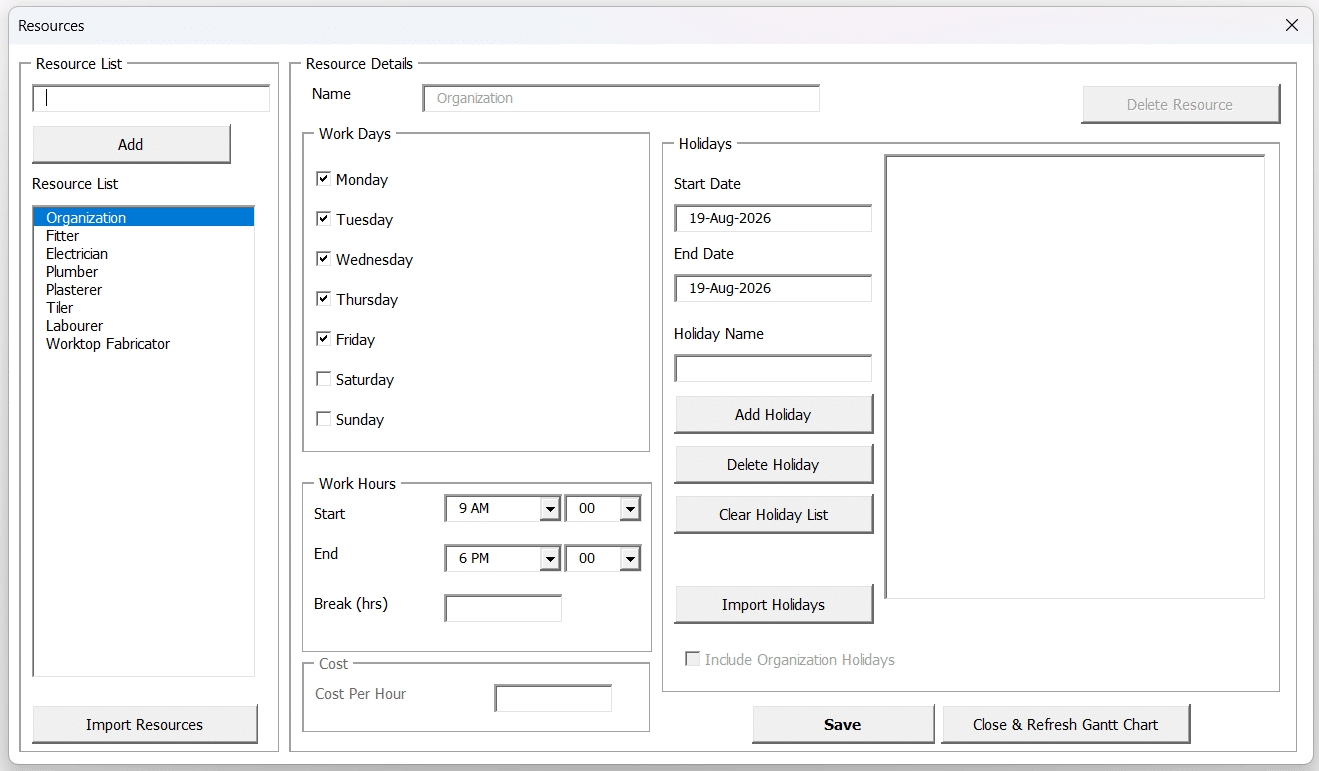
One window per project: the people, their rates, their working days and their holidays.
The web report in section 10 adds a resource load chart: how much work each of the twelve busiest people is carrying, heaviest first. It’s the quickest way to spot one person holding the whole project up. Calendars, rates and holiday lists are all in Resources, calendars and working days.
08 Keep the money on the same rows as the work
Each task carries five numbers besides its dates. Two are worked out for you and three are yours.
| Column | What it holds | Who fills it in |
|---|---|---|
| Work | How much person-time the task needs | Calculated, until you override it |
| Resource Cost | Labour, priced from the rates of the people on the task | Always calculated |
| Est. Cost | What you now expect the task to cost | You |
| Baseline Cost | What was agreed when the plan was signed off | You |
| Actual Cost | What it really cost | You |
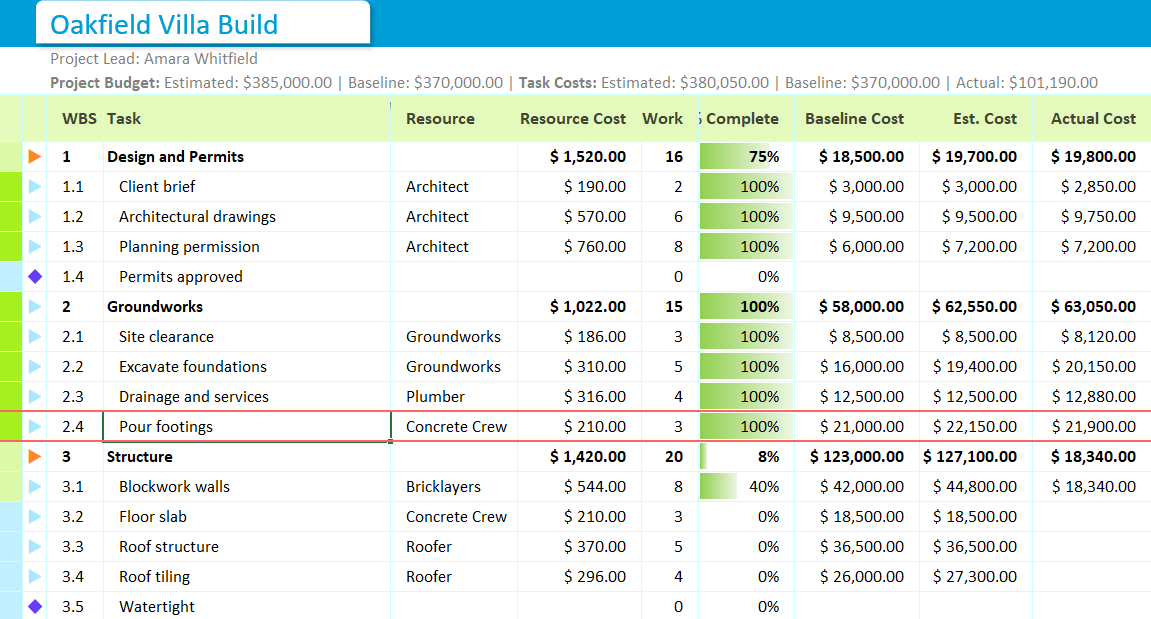
The money and work columns side by side. On a normal chart there are other columns between them.
Resource Cost is labour only. Materials, fees, hire and anything else go into the three cost bands you fill yourself. Phase rows add up everything beneath them, and the project as a whole carries its own estimated budget and baseline budget, set when you create the chart.
If money isn’t part of your job, untick Enable Costs and the columns go away. If it’s most of your job, the project budget planner goes further than this page does. Work, costs and budget has the detail.
09 See the whole project, or every project, on one dashboard
The plan is for the person running the project. Everyone else wants the answer to one question: how’s it going? The project dashboard answers it on a single sheet.
Open it from Gantt Excel → Dashboard → Project Dashboard. Along the top: the estimated budget, the actual cost so far, and how far over target that is. Beside them, a completion figure and a summary of the lead, the dates, the total work and the task counts: completed, in progress, not started and overdue. Below, charts of tasks by status and priority, a cost comparison, and slicers for status, priority, resource and due date.
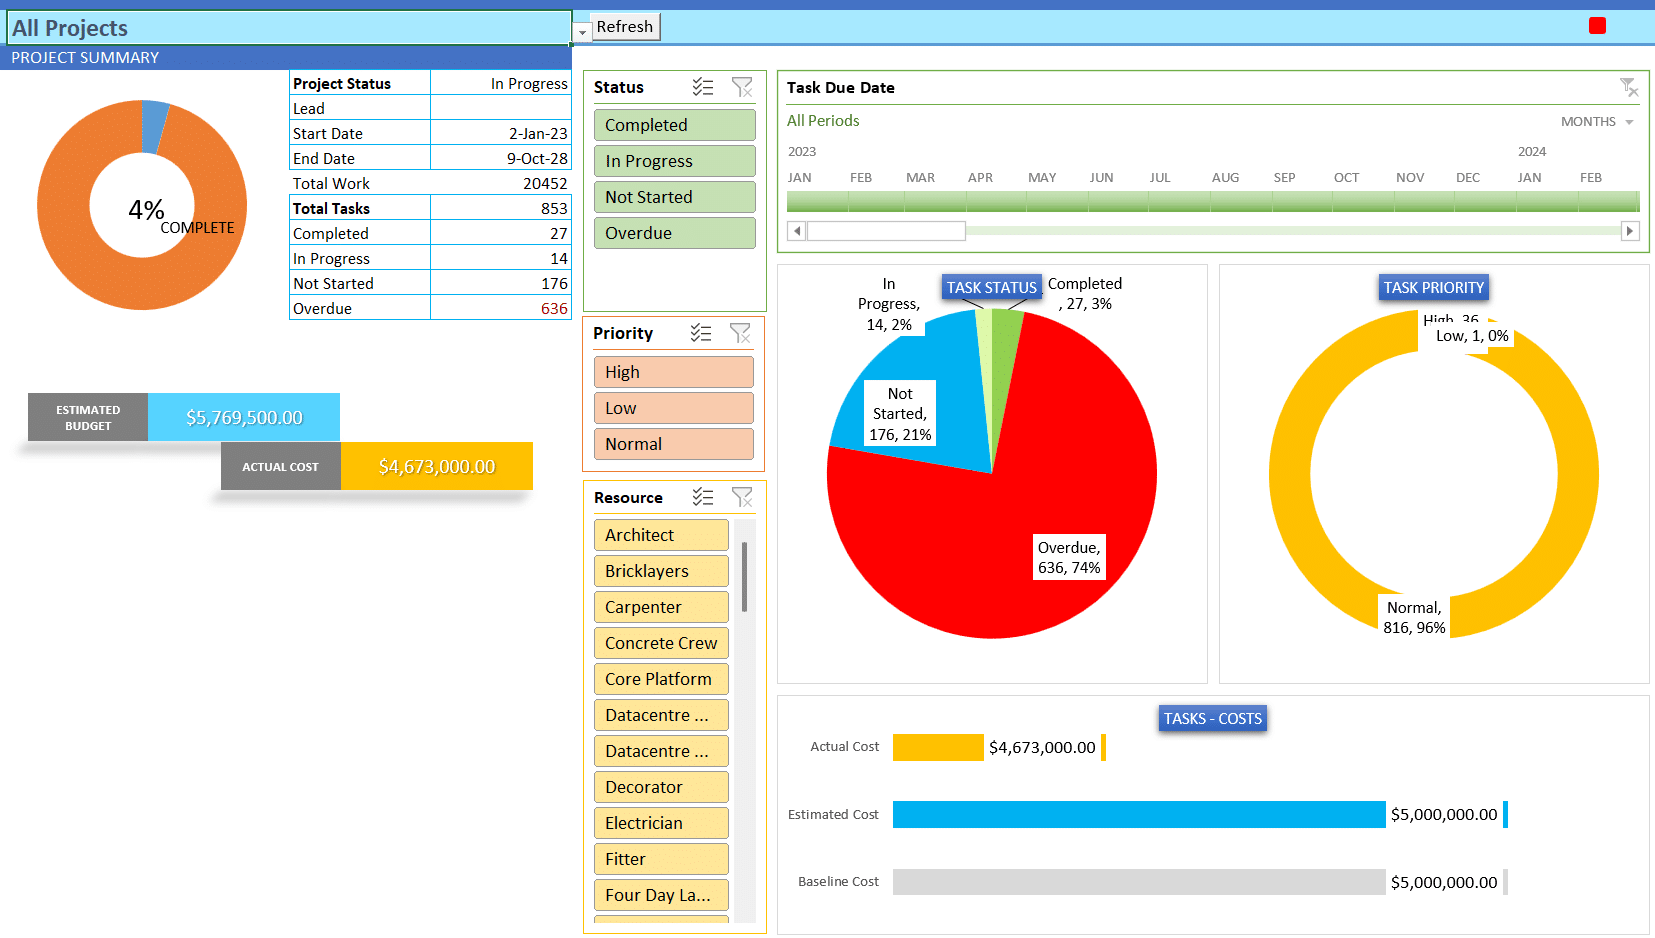
Everything here is read from the plan. You never type into the dashboard.
The Over Target tile is simple arithmetic. A kitchen refit with an estimated budget of £12,000 and £13,800 spent reads 15% over. On or under budget, the tile is blank, so an empty tile is good news.
The dropdown at the top lists every project in the workbook, plus All Projects. Choose that and every tile, count and chart covers the lot: budgets summed, tasks counted across every chart, earliest start to latest finish. One caution: All Projects doesn’t convert currencies, so if one job is in pounds and another in dollars, read them one at a time. The project dashboard guide covers every tile. There’s also a page on project dashboards in Excel.
10 Send a status report to people who don’t open Excel
Clients, directors and subcontractors rarely want your workbook. They want a status report they can read on a phone. Dashboard → Web Report (HTML) writes one: a single HTML file that opens in any browser, with no Excel, no login and no internet connection needed.
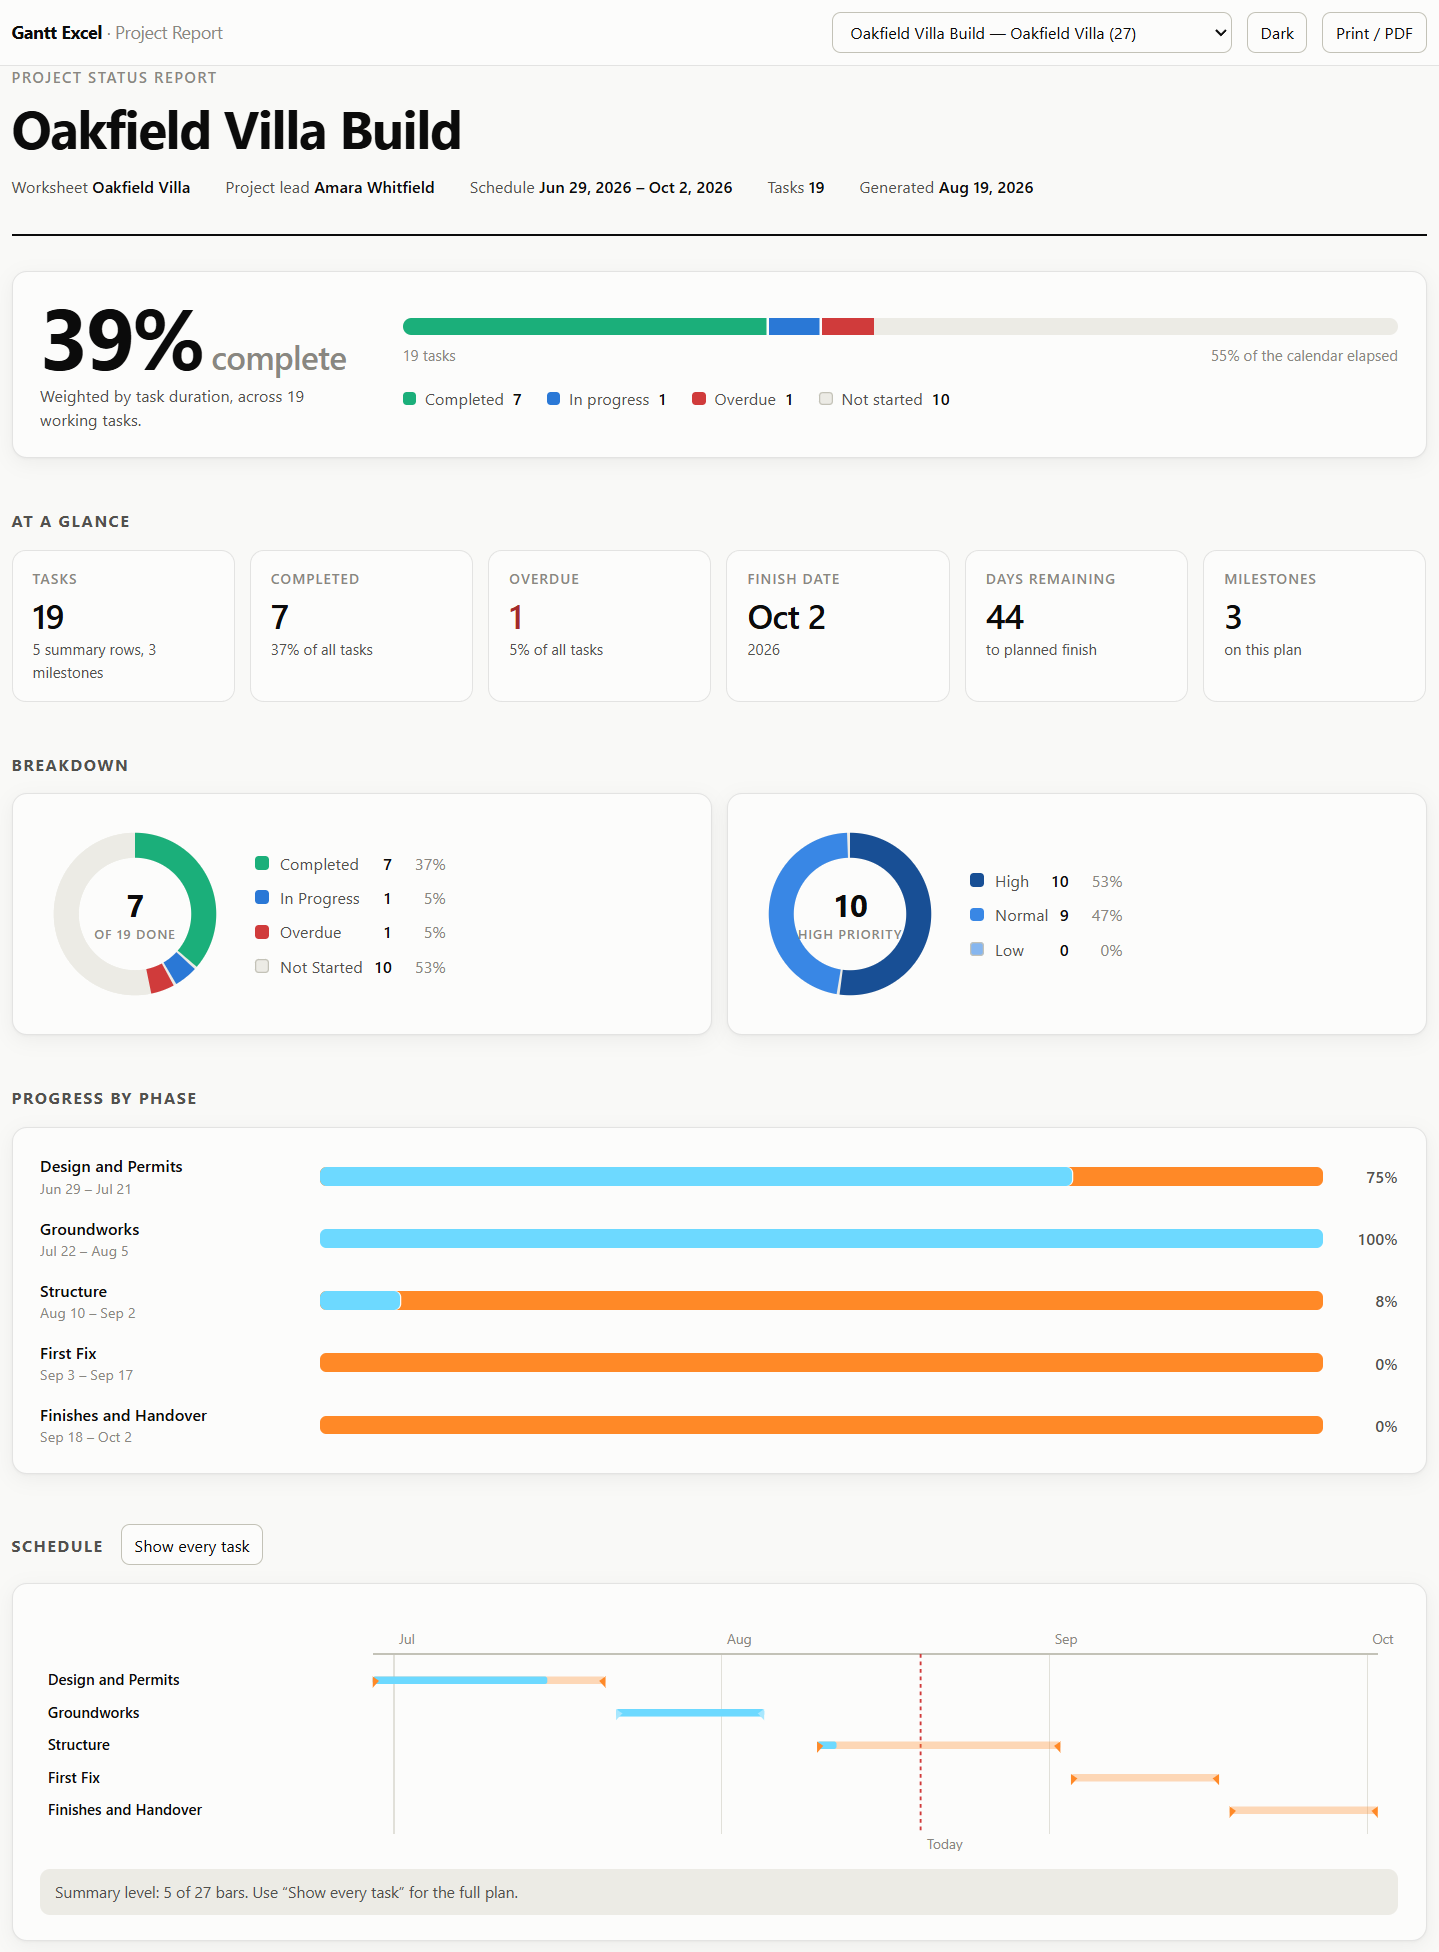
One file, headline first. The schedule opens folded to phase level, which is what a client reads.
It’s built in the order a reader wants it. The headline percentage and a status bar first. Then tiles for tasks, completed, overdue, the finish date and the days remaining. Then progress by phase, the schedule, the critical path, the eight most overdue tasks, the resource load, and the costs, including earned value: what the work finished so far was budgeted to cost. Sections with nothing to say are left out, so a small plan makes a short report.
Read the warning before sending an all-projects report. You can export one project or every project in the workbook. The all-projects file lets the reader switch to any of them, including ones that belong to other clients. For anything leaving your own team, stick with This project only, which is the default.
The report has its own Print / PDF button, and a PDF or XLSX of the chart itself is one click from the Export section. The web report and Exporting and printing cover both.
11 Run several projects from one workbook
Most people managing projects are managing more than one. In the template, every project gets a sheet of its own with its own calendars, settings and timeline. Add the next one with Add New Gantt Chart, and the dashboard and web report can take them one at a time or all together.
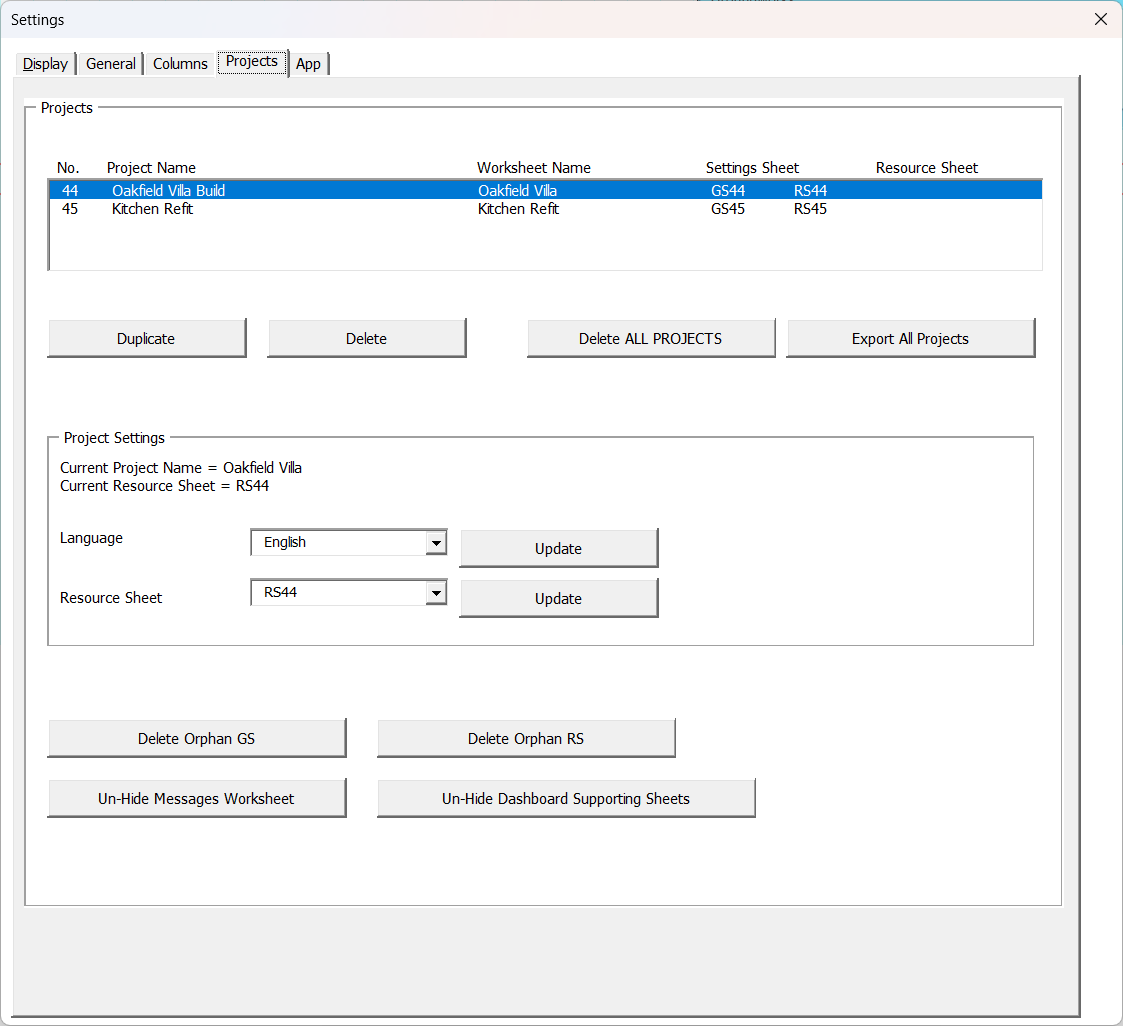
One row per project, with the buttons that copy, delete and back them up.
The Projects tab of Settings lists them. Duplicate is the one to know. If you run the same kind of job again and again, build one project with your columns, colours, currency and calendars the way you like them, then duplicate it for each new job. Settings belong to each chart, so a brand new chart starts from the defaults and a duplicate starts from yours.
Export All Projects writes every project to one plain XLSX with no macros. It’s a good end-of-month archive, and the licence details are stripped out of it, so it’s safe to put in a shared folder.
12 Where a spreadsheet stops being the right tool
The template is an Excel workbook, and that decides who it suits. It has one owner at a time, like any Excel file. It lives wherever you keep your files. It works offline, on a plane or behind a company firewall, and nothing about your project goes to anyone else’s server.
If your team needs to update the same plan at the same moment from their own desks, with comments, approvals and notifications flying around, a web-based project tool built for live collaboration will suit you better, and it’s worth paying for. Most projects run by one person or a small team, with a wider group who just need to know how it’s going, fit a workbook well. That’s the shape this template is built for.
The free file, and what Pro adds
The free download is the place to begin: tasks, subtasks and milestones on a chart that reschedules as you edit, with no expiry date. Most of this page, including resources and costs, baselines, the critical path, the dashboard, the web report and one-click export, comes with Gantt Excel Pro. That’s the same workbook with unlimited tasks and unlimited projects. It’s one payment and the licence doesn’t expire.
Common questions
Can you really manage a project in Excel?
Yes, if the spreadsheet does the scheduling for you. A plain spreadsheet can list tasks and dates, but every change means retyping the dates that follow. A template that links tasks, counts working days, rolls phases up and reports on progress handles the parts that make a plain sheet fall apart after a few weeks. Where Excel is the wrong choice is live editing by many people at once.
What should a project management template track?
Progress on each task, what’s overdue, who’s doing what and when they’re available, cost against budget, and the gap between today’s dates and the ones you agreed at the start. Add a way of reporting it to people who don’t open the file. Anything beyond that is optional.
How is this different from the project plan template?
It’s the same workbook, used at a different stage. The project plan template page is about building the plan: tasks, phases, links, milestones and the baseline. This page is about running the project once the plan exists: progress, status, people, money, slippage and reporting.
How do I show which tasks are overdue?
Turn on Show Overdue Bars in Settings. Any unfinished task past its end date is drawn in the overdue colour. The dashboard counts overdue tasks, and the web report lists the eight most overdue, worst first, with how many days late each one is.
Why won’t the Status column let me type in it?
Status is calculated from % Complete, so there’s nothing to type. 0% is Not Started, 1 to 99% is In Progress and 100% is Completed. Change the percentage, or tick Done, and the status follows.
Should progress be entered manually or automatically?
Manually, for a real project. Automatic works out the percentage from how much of the scheduled time has passed, which says nothing about whether the work is getting done. It’s useful for demonstrating a plan or for work that really does progress at a steady rate.
Can I manage several projects in one workbook?
Yes. Each project is its own sheet. The dashboard and the web report can show one project or all of them together, and Settings has a Projects tab for duplicating, deleting and exporting them. Pro has no limit on the number of projects.
Can I share progress with someone who doesn’t have Excel?
Send a web report. It’s a single HTML file that opens in any browser, works offline, and has its own button for saving as PDF. A PDF of the chart itself is the other option.
Can more than one person edit the file?
One at a time, like any Excel workbook. Keep it somewhere the team can reach and agree who updates it and when. If several people need to edit the same plan at the same moment, a web-based collaboration tool is a better fit.
Does it work on a Mac?
Yes, in Microsoft Excel on a Mac as well as on Windows. On a Mac you use the ribbon for everything, since the Gantt Excel right-click menu is a Windows addition.
Run your next project from one file
Build the plan, set the baseline, then spend half an hour a week keeping it honest. The template does the arithmetic.
Runs in Microsoft Excel. Nothing to install, no account.